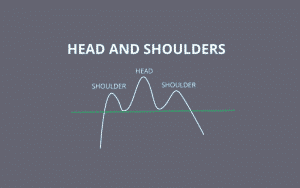
Many aspects of our lives move in cycles, and the financial themes are not an exception. Every asset shows upward movements that, sooner or later, are exhausted and begin to fall, then price increases again.
This behavior is repeated in time and is called market phases. It is crucial to keep in mind that the investment process involves applying a series of analyses that experts carry out to understand some behaviors that can give clues to what will come in the future.
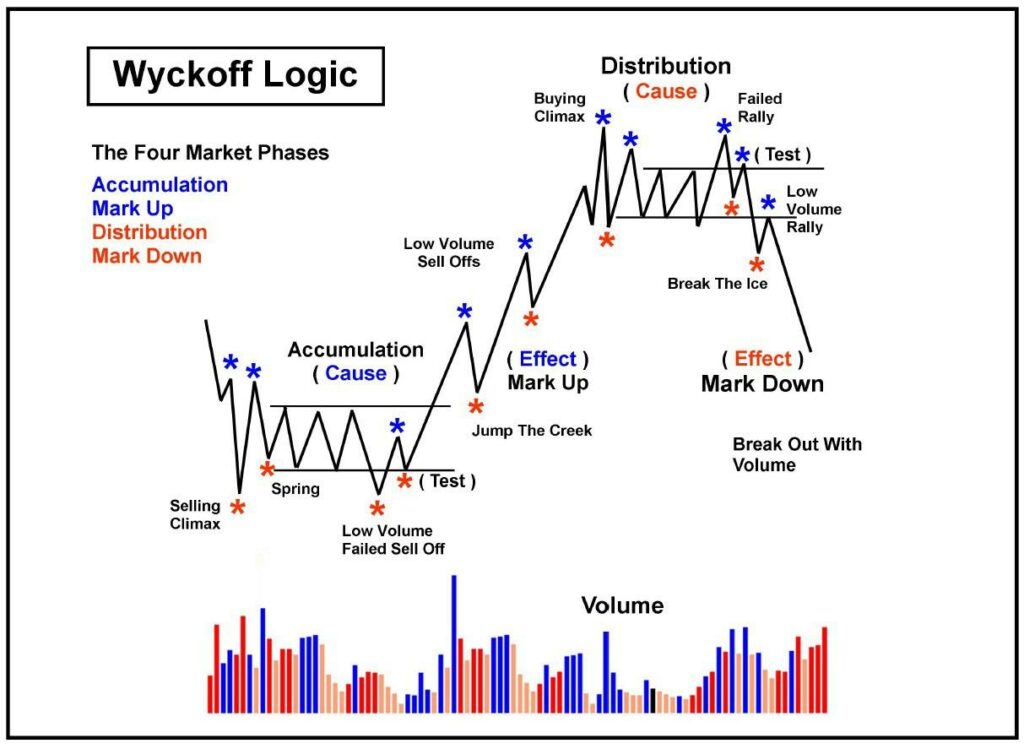
A little bit of history: Wyckoff logic
Richard D. Wyckoff (1873-1934) was an early 20th-century pioneer in the stock market and considered one of the most influential men in technical analysis.
Wyckoff started to operate at a very young age and in his studies. He reflected on his learning, coming up with the theory that a financial asset has four phases.
- Accumulation: We reached this just after a prolonged period of a downtrend. During the bearish trend, sellers have controlled the situation, but now the price begins to move sideways, forming a base. The selling force has been declining, and buyers’ confidence has increased. At this stage, traders lack trust in neither the prevailing buying force nor selling one.
- Markup: the price leaves the lateral range, and the uptrend begins. Although it is the clearest impulsive wave, the beginning is fraught with mistrust caused by the previous downtrend. By the time most investors realized that the market was in an uptrend, it could be late to get in.
- Distribution: starts after a prolonged upward movement. The buyers are those who have denied part of the route of the previous phase. Investors are trying to convince themselves that the lateral movement in which the market has been delimited is now just a consolidation stage to continue with the uptrend. However, smart people who bought earlier are already selling their positions.
- Mark Down: When the lateral range begins to break down, most investors perceive the move as a normal correction, but in fact, a new downside rotation has begun. The environment is favorable, with still positive news and low perception of risk. That is why it is difficult to think that the upward process has ended. Usually, traders realize late that they are badly positioned, and when they want to change their minds, they are losing money.
From theory to practice
It seems easy to recognize market phases in charts, but in the real world, it is not. Volatility, news, and many other factors may affect the price.
I will show an example of the Boeing daily chart. We see from 2014 until the crash in 2020, where the stock has completed the cycle.
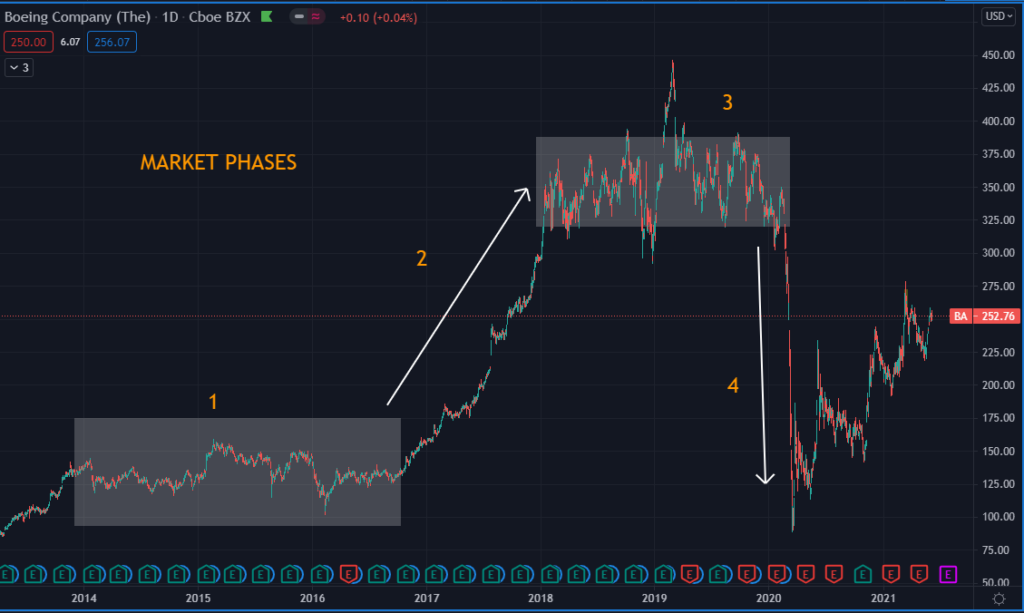
Remember, markets are cyclical, so these phases repeat over and over. Also, it is important that you identify phases in the time frame you are trading. Keep in mind how seasons and sector rotation influence certain assets.
For beginners, it is easier to recognize in higher time frames, like daily, because smaller time frames have much more data and noise.
Cycles can last from a few minutes to years, depending on the time frame you are analyzing. For example, intraday traders may observe five minutes to one-hour charts, while long-term investors may observe one week or maybe a monthly chart.
How can we recognize and trade the market phase?
If you are a beginner, simple indicators could work. For example, one of the most used by traders is Moving Average (MA).
In this example, we can see that after a downtrend, 50 period MA (yellow line) is flattening, and price forms a range, which could indicate the asset is in the accumulation zone. A Moving Average works very well in trends, thus, in times of expansion.
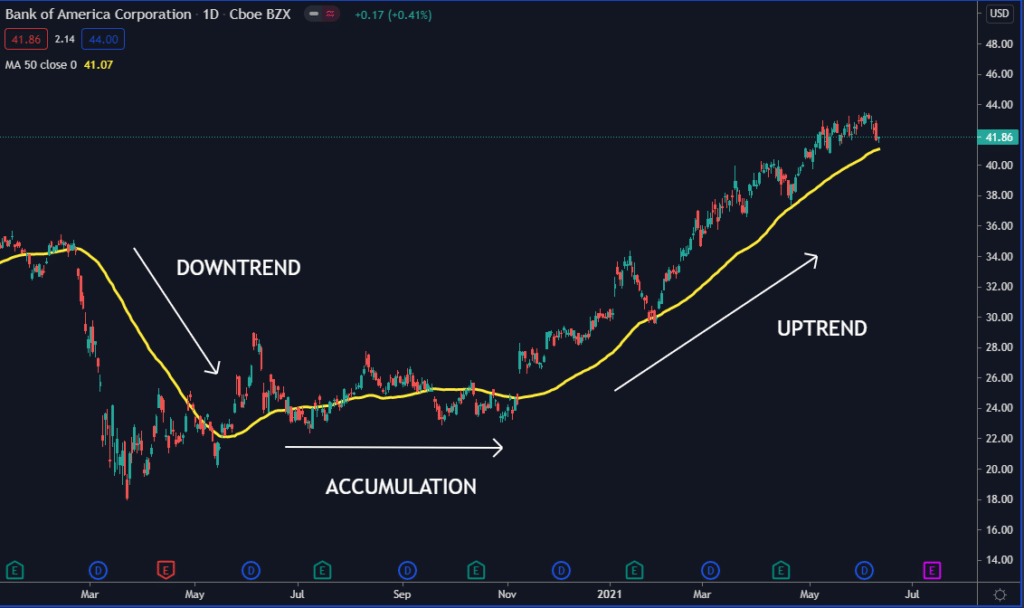
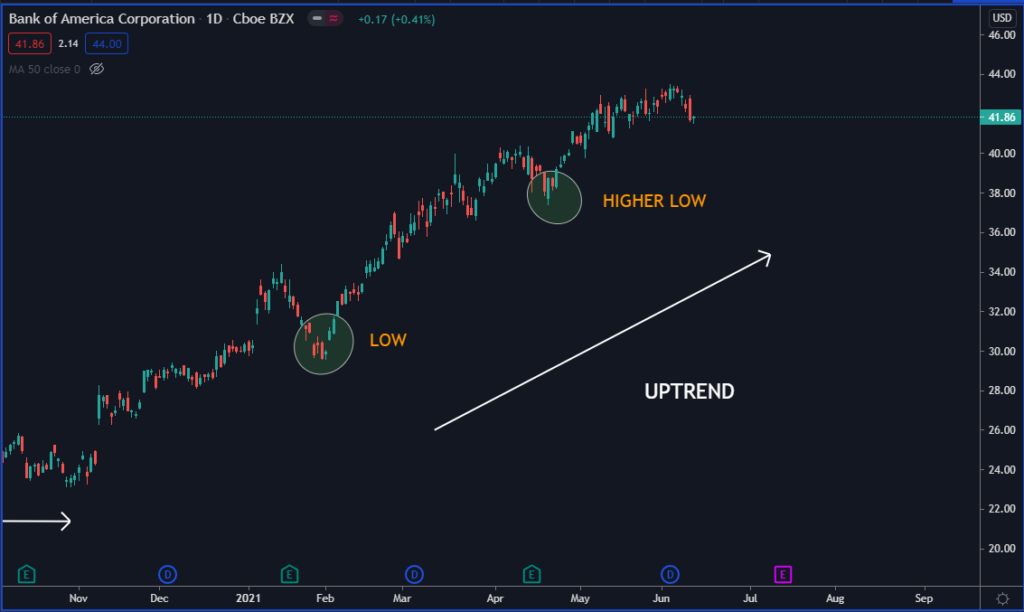
If you have more experience, it is better to watch the price action. Look for support and resistance and pay attention if the price is touching new zones, higher highs, or lower lows.
This will help you identify the turning points of the asset. In the example below, remove the Moving Average, and look that the second low is higher. Therefore the uptrend is confirmed.
How to use market psychology to your advantage
Many analysts believe that emotions drive prices up and down. The idea is that investor sentiment is what creates the psychology of a market cycle.
For a buyer, their greatest financial opportunity may come when the asset is at its lowest point when nobody wants to invest, and this could be the best time to do it.
At the same time, the greatest financial risk can occur when sentiment is highly positive and everyone is greedy. In such an environment, we have to be careful.
One of the problems is that most investors and retail traders fail to recognize that markets are cyclical or forget it. Another significant challenge is that even when you accept the theory, it is nearly impossible to pick the top or bottom and have big gains. Without a doubt, a good understanding of this is essential if you want to maximize profit.
No matter what market you are referring to – forex, commodities, or the stocks; all go through the same 4 phases. When one is finished, the next one begins.
Final thoughts
The idea is to operate in favor of the trend. Do not forget that the market, even in an uptrend, suffers corrective waves, and it is always easier to operate in the trend’s direction than against it.
We should try to be active at the beginning of phase 2 (buying) and at the beginning of phase 4 (selling). During phases 1 and 3, we should take advantage of the preceding move, and close short or long positions, as we never know what the future has prepared for us.

