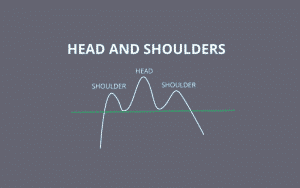
Descending broadening wedges are nonparallel trend lines that slope downwards in a stock chart while broadening out. They depict a reversal from a bearish trend and open the way for a bullish upward breakout. The best patterns form for a considerable time, with a rising volume at the breakout.
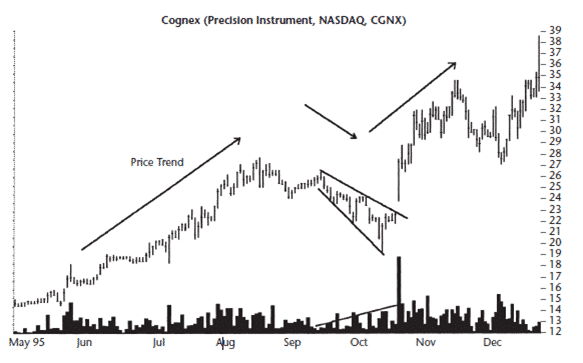
The wedge-like formation broadens and consolidates out (in chart 1) in a downward direction as the trend breaks out sharply upwards. Volume may fluctuate as the price remains under pressure. Chart 1 shows that the wedge forms in a medium-term change in the trend in the context of the long-term bullish market.
The market grows from June to September, with prices rising from $16 to $27. The wedge forms during the short-reversal as prices decline after the downward breakout of $26 in mid-August before rising again to $26 in October.
The wedge begins from mid-September to mid-October before the sharp upward breakout occurs.
Identification of the DBW
There are three main factors you have to pay attention to confirm that what you observe is a broadening wedge formation.
Shape
The descending broadening wedge (DBW) consists of two non-parallel trend lines that are moving downwards. In the chart below, the formation began on October 21, 2021, before the bullish breakout on November 4, 2021. The lower trendline is slightly steeper as the wedge broadens over time.
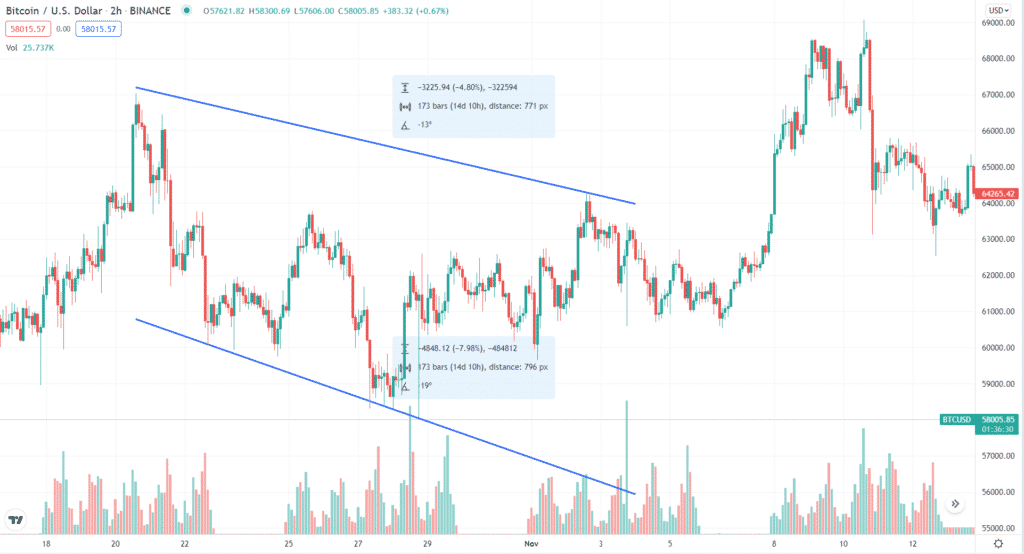
Downward trendlines
In order to draw the two trendlines that form the pattern, each trendline needs to be tested at least twice, i.e. it should be touched by the lower lows and lower highs of the price at least twice
Breakout
As earlier indicated, the breakout is upward, i.e. bullish, especially if the wedge is formed from a downward slope. It is mostly opposite the direction of the previous trend.
The previous trend, in this case, is a partial or short-term decline. The decline should begin when the prices hit a top trendline and then turn downwards. The partial decline precedes an upward breakout.
In the previous example, the price of Bitcoin (BTC) against the dollar reached $67,035on October 21, 2021. It dropped to $30,0084.60 on January 11, 2021.
The BTCUSD began a partial decline when it hit a high of $40,283.24 on January 14, 2021. The lower trendline of the wedge-like price action began at $34,259,89, while the upper trendline was at $39,051.19.
The descending broadening wedge (DBW) pattern forms from January 16, 2021, to January 27, 2021 (11 days) before the upward breakout. After the trader spots the partial decline and the DBW, there is a high possibility that the price decline will soon be cut short as the asset prepares to start the upward run.
We should also consider that although the preceding trend can also be bullish before the broadening descending wedge is formed, the DBW may indicate a bearish reversal (as seen in the chart below).
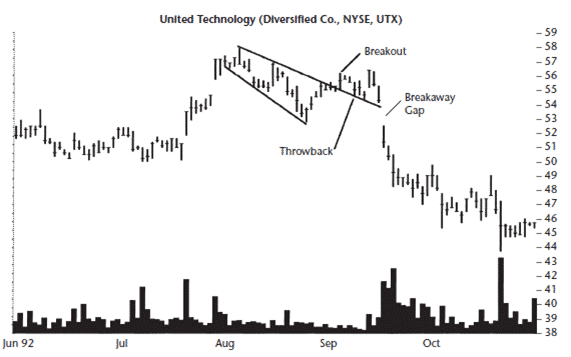
However, the formation described above in the third chart is not perfect, and the trader may term it as a failure. The movement of the prices was limited to 5% after the breakout occurred. The stock’s price should move in the opposite direction in most cases as it meets overhead resistance.
How do you trade a broadening wedge?
- An upward breakout that identifies as a continuation will work better than a reversal. In a bull market, downward breakouts signal reversals as compared to continuations. After prices reach their ultimate highs, on average, they tumble 20-33%. For example, after prices reached an all-time high of $58,284.86, they decreased 21.73% to $45,622.13 on February 26, 2021. The trader should be prepared for further decreases as it may reach a low of 40% before it begins to rise again.
- A partial decline, in most instances, is followed by an upward breakout. The breakout is confirmed if the decline begins after testing the top trendline. The breakout often reaches annual or all-time highs, as witnessed in the recent rally of Bitcoin.
- You can buy when the price reaches the bottom trendline and sell when the prices move to the top trendline. You can also sell short at the top of the wedge’s trendline but keep in mind that it is a partial decline, and prices are likely to rebound higher eventually.
Trading the descending broadening wedge step by step
Below are the steps of trading the pattern.
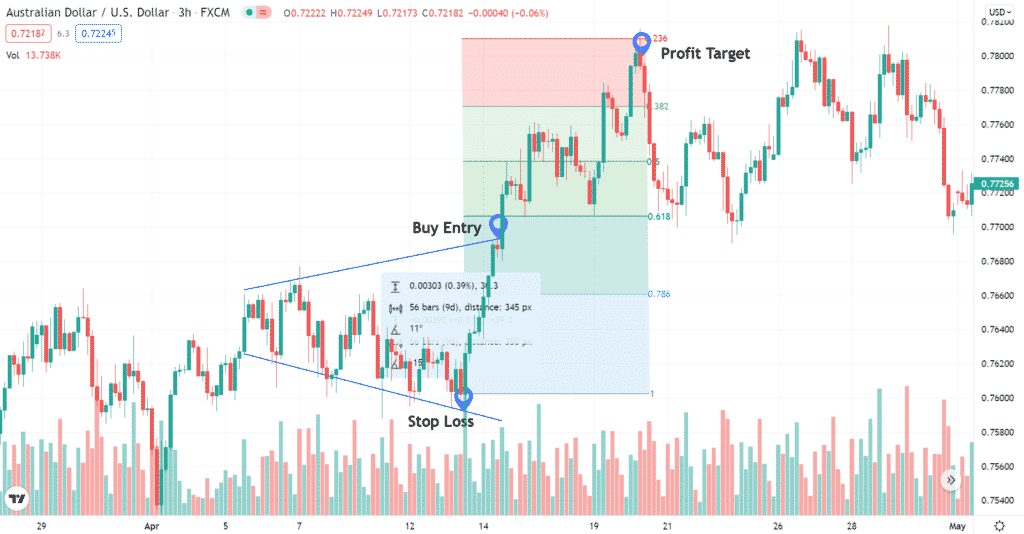
- Place a buy order (long entry) above the upper trendline to enter the market at the breakout.
- Wait for the candle to close above the top trendline before entering to avoid broadening wedge false breakouts.
- Place the stop-loss below the broadening wedge’s bottom. The chart above portrays that the stop-loss should be placed below the bottom side of the broadening wedge.
- The profit target is obtained by adding the height of the pattern (the difference between the absolute high and the absolute low of the pattern) to the price at which the market broke through the trendline. Alternatively, you can use the potential resistance area to project the target price (see the GBPUSD chart below).
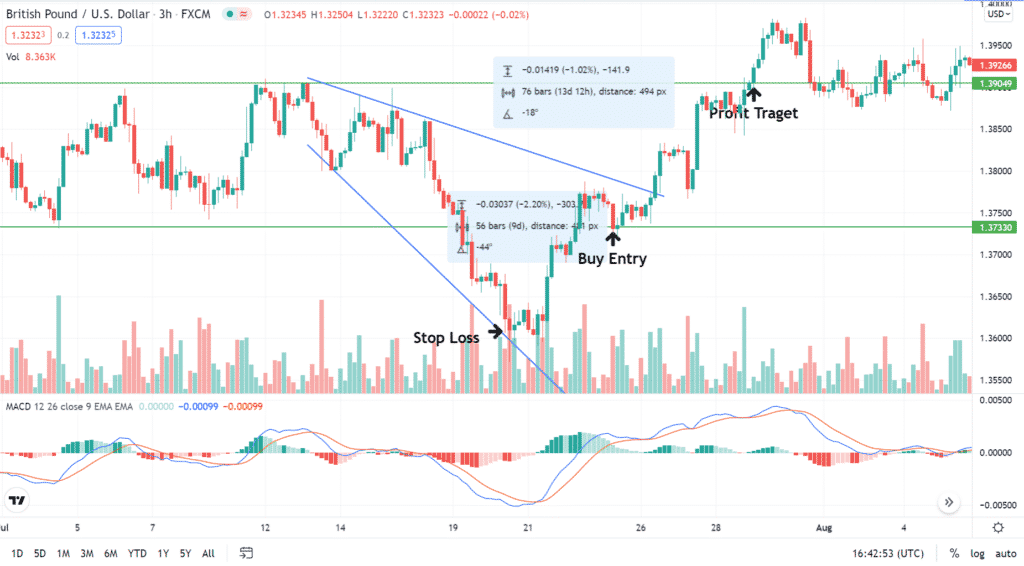
It is important to note that sometimes, a broadening wedge formation will have a false breakout. In the GBPUSD chart above, you can see prices attempted a downward breakout before retesting the support and embarking on an uptrend. This uptrend then went on to cause the actual breakout of the upper trendline.
Ascending broadening wedge – what is the difference?
Let’s look at the pattern execution steps in the list below.
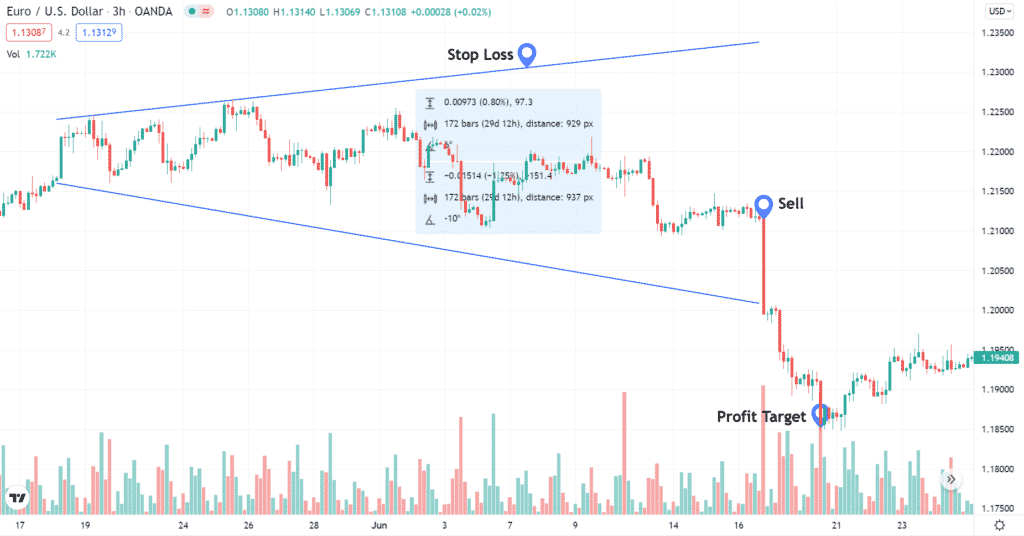
- We must wait for the price to trade below the trend line (break support).
- On the retest of the trendline, a sell order should be placed (broken support now becomes resistance).
- The point at which the price encounters resistance at the lower border of the wedge is the sell entry.
- The stop-loss can be placed above the pattern’s high, as shown in the chart below.
- The distance between the entry (sell order) and the take profit is the same as the height of the wedge.
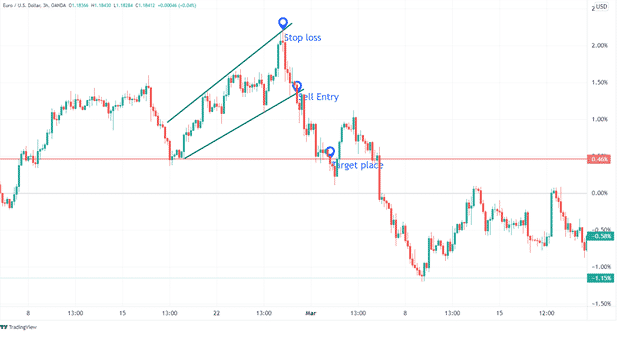
In the chart above, you see a potential sell entry when the pattern’s down boundary was broken and retested. Notice that the price target coincides with a couple of down swings’ lows that retested the target price area before. The areas of potential support give us another reason to consider exiting the short-sell positions nearby.
Some sources will refer to this formation as an inclining broadening wedge.
What does broadening formation mean?
A broadening formation is an example of a consolidation pattern that can be used to indicate the likelihood of a trend reversal. When detected in an uptrend, it signals a near-term reversal of the market action rather than a continuation of the trend.
The broadening formation happens when price fluctuation causes a succession of higher highs and lower lows that gradually expand over time. It is often regarded to only be observed in topping formations, where it is thought to be the product of bullish investors’ unreasonable expectations.
Broadening forms, unlike most other consolidation patterns, have increasingly wide ranges and are vulnerable to substantially higher levels of volatility as time goes on. Although rising volume usually implies a bullish position, rallies, in this case, are usually very short-lived, and subsequent drops are prone to decimating past support levels, eventually leading to a collapse.
There are different types of broadening patterns.
Symmetric broadening wedge
Symmetric broadening wedge patterns are defined by an increasingly significant price oscillation between two diverging trend lines. As the pattern develops, the volume increases.
The currency price can either break out through the top or through the bottom. Therefore the pattern resolution is random.
The kinds of right-angled broadening wedges
A right-angled descending broadening wedge is a bullish reversal pattern. It is formed by two diverging lines, with the resistance being a horizontal line and the support being a bearish downward slant.
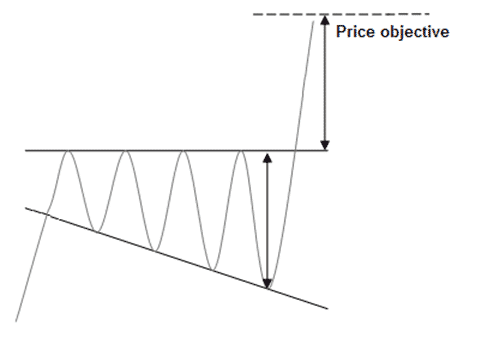
As a result, the oscillations between the two triangle endpoints are growing in size. Each line must be touched at least twice.
A right-angled ascending broadening wedge is a downward reversal pattern. A right-angled ascending triangle is formed by two diverging lines, with the support being a horizontal line and the resistance being an oblique bullish line.
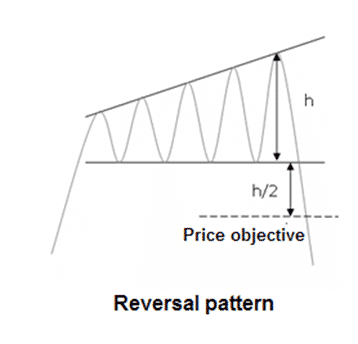
As a result, the oscillations between the two triangle endpoints are increasing in size. Each line must be touched at least twice.
Bulkowski broadening wedge
The Bulkowski ascending broadening wedge is a chart pattern that appears in a bull market. They’re more common in bull markets with a downward breakout.
Identification guidelines
- Price trend
It can be up or down, leading to the pattern
- Shape
The pattern looks like a raised-up megaphone.
- Trendlines
Both trendlines are upward sloping. The top one has a steeper slope than the bottom one.
- Touches
At least three peaks and valleys should be in contact with their respective trendlines.
- Volume
Volume is irregular but trends up 64% of the time
- Breakout
73% of the time, it is downward.
Is an expanding wedge bullish?
An expanding wedge pattern can signal either bullish or bearish price reversals. The two forms of the expanding wedge pattern are descending expanding wedge and the ascending expanding wedge. An ascending wedge can appear in either a downtrend or as a continuation pattern, attempting to extend the current bearish move. It can also happen during an uptrend, resulting in a reversal pattern.
A descending expanding wedge is a bullish chart pattern and is said to be a reversal pattern. It is made up of two bullish lines that diverge. If there is a good oscillation between the two, a broadening descending wedge is confirmed/valid.
Is a wedge pattern bullish?
A wedge pattern can indicate market reversals in either bullish or bearish directions. A rising wedge (which indicates a bearish reversal) or a descending wedge (which indicates a bullish reversal) are the two types of wedge patterns (which signals a bullish reversal).
Identifying broadening tops & bottoms
Broadening top
The broadening top is a chart pattern used in technical analysis to describe the trends of stocks, commodities, currencies, and other assets. Its appearance usually indicates the start of the bearish trend.
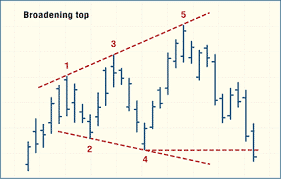
During its formation, the majority of the selling is done by big players in the early stages, with participation from the general public coming later.
Identification guidelines
- Price trend. The trend is upward prior to the pattern. That is, the start of the trend is lower than the start of the pattern.
- Shape. The pattern has a megaphone shape with higher peaks and lower valleys.
- Trendlines. The top trendline is slanted upward, while the lower trendline is slanted downward.
- Touches. Three peaks or three valleys should touch the related trendline with two or more touches of the other trend line for a total of at least five touches. The second of three touches should, ideally, touch (rather than ‘come close to’) the trendline. This eliminates the problem of price forming an upward-sloping channel with an upward spike at the end of the pattern.
- White space. Price should cross from side to side throughout the pattern, filling the space with movement.
- Volume. The volume is upwards of 65 percent to 67 percent of the time (in up breakouts).
- Breakout. It happens when the price pierces a trendline or rises above/below the pattern’s boundary, and it can occur in any direction (upward 60% of the time).
Broadening bottom
Broadening bottom is formed when the price comes to a halt before creating a lower low (after making at least two highs and two lows) and continues higher, taking out the previous high.
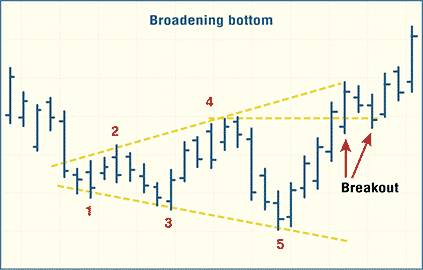
Identification guidelines
- Price changes. The pattern is found in a downtrend. That is, the closing price at the start of the trend is higher than the close at the start of the pattern.
- Shape. The pattern has a megaphone shape with higher peaks and lower valleys.
- Trendlines. The top trend line is sloped upward, while the bottom trend line is sloped downward.
- Touches. Three peaks or three valleys should touch the related trendline with two or more touches of the other trend line for a total of at least five touches. Ideally, the second of three touches should touch (rather than ‘come close to’) the trendline.
- White space. Price should cross from side to side throughout the pattern, filling the space with price movement.
- Breakout. It happens when the price pierces a trendline or rises above/below the pattern’s finish, and it can happen in any direction (upward 60% of the time).
Trading broadening top & bottom
Broadening top
- Day traders and swing traders should trade with an uptrend when the price breaks out from the top pattern boundary.
- At the upward breakout price/entry point, consider buying.
- Calculate the target price by adding the pattern height to the breakout price to identify an exit.
- The pattern height is the distance between the highest high and lowest low of the pattern.
- Consider placing a stop order to exit near the breakout price to limit the possible loss when the price suddenly goes in the wrong direction.
Broadening bottom
- Wait for the price to go over the upper trendline of the broadening bottom.
- As soon as the price rises over the pattern’s upper trendline, enter the market.
- Once the resistance is broken, place a buy order after the price retests that trendline.
- The level of broken resistance has now become a level of support.
- Put your stop-loss order below the new support level.
- Set your profit target.
- Determine the height of the pattern. To find a profit target, add the height of the pattern to the breakout price.
Summing up: technical analysis of broadening wedge
When dealing with a broadening wedge, a breakout frequently reverses the wedge’s preceding trend. Therefore, when trading this pattern, wait for the reversal, look out for the retest, then enter your trade when the support turns resistance or vice versa. You can use the area near the breakout point to set a stop-loss to protect you if the breakout is false.


