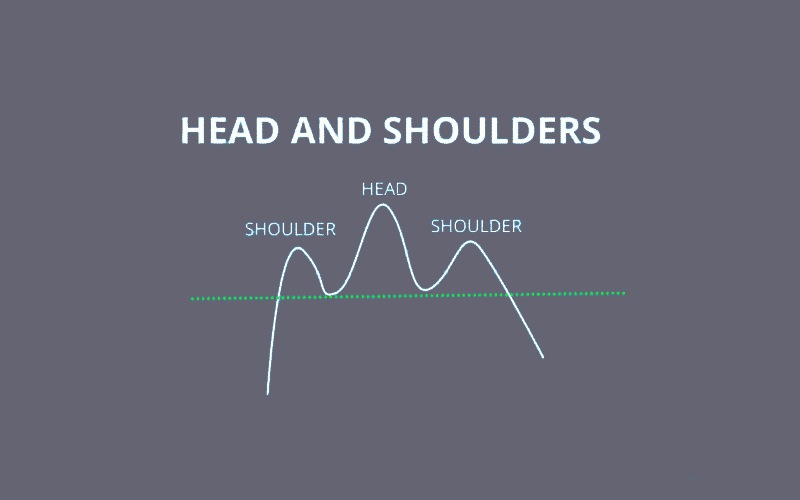
The head and shoulder top is a chart pattern with three distinct peaks forming in a bullish (top or rising) trade. The center or middle peak is taller than the two (shoulder) peaks that almost form an equal height. This pattern forms in a short-term bearish reversal. It is commonly used to usher in a bear as opposed to a bull market. The pattern performs well when the volume is greatest in the middle bump, falling as it joins the right bump or peak. The left peak is formed from an upward trendline or a prior rise in prices. While it is common in long-range analysis such as yearly or five-year analysis, it can also be spotted in a short-term trendline based on volume and price adjustments.
Identification
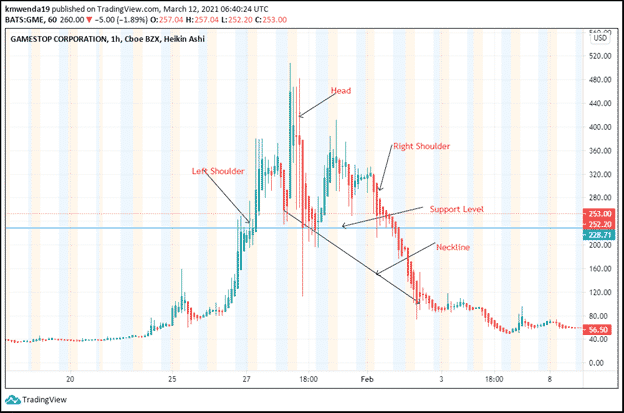
Figure 1: GameStop Corporation Analysis Chart
In this article, we will analyze the GameStop Corporation (GME) and seek to identify our pattern of interest. The general characteristics of the head-and-shoulders tops are followed by the GME stock, as shown in figure 1. The head-and-shoulders tops pattern is formed after an upward price motion. The three bumps shown indicate that the middle peak is the highest of the three peaks.
1. Volume pattern in the shoulders.
The left shoulder shows that the volume pattern rises as the stock forms the left shoulder. It declines as the stock’s price moves towards the right shoulder.
2. Sloping Neckline
The neckline is sloping downwards, indicative of a weak and highly volatile market. Prices can fall as low as $56 and still rise to highs above $250. This neckline connects the lowest positions of the two shoulders. The trader can either buy or sell once the stock’s price crosses this line.
3. Symmetrical Appearance
The peak position of the two shoulder tops is almost equal or at the same level. The middle peak or the head is the highest point in the pattern showing that the chart follows the general rule.
As noted before, this chart appears after a long uptrend. However, since the prior bullish movement occurred for a shorter duration, we may see a short-term reversal of the downtrend once the pattern crosses the neckline support level. It may rise to its peak position, as will be seen in the next chart pattern.
Key points
- After prices rise to the first peak (left shoulder), they decline to the prior price that forms support for the other two peaks. In figure 1, the support level is at $252.20. We see that the two remaining peaks touch this support level before going up. The third bump, however, follows the reversal rule, and the price meets resistance at this level and begins tumbling down.
- The neckline connects the first and second depression points. In our case, the falling neckline in the short-term forecasts a break from the bearish reversal expected.
- The support level reached at $252.20 has turned into a resistance point. On March 11, 2021, GME stock closed at $265, indicative of a struggle to regain the new year highs.
Trading strategy
Trading the head and shoulders pattern includes several clear steps. Let us take a tour together.
Step 1. Compute the distance between the head and the neckline
Identify the price target by computing the distance between the neckline position and the head top. However, this distance is calculated after the support level of the neckline is broken. The head position denotes the 52-week high of $483.00 of the stock. To get the distance, we subtract the 483.00 with 252.20, which equals 230.80. With the break of the neckline at $252.20, the price will move around $228-260.
Step 2. Extrapolate the neckline to derive price movement
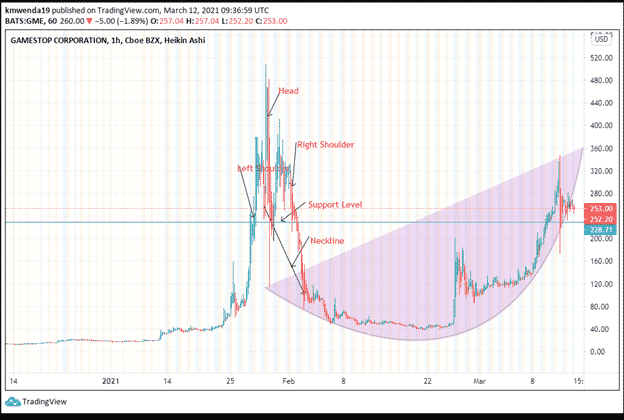
Figure 2: Extrapolation of the neckline to get the price target
The trader can also extrapolate the breakout point of the neckline to get the price target. In using the arc, we can be able to track the least price that the stock can move as it adjusts around the support level. In the short term, GME stock price is seen to hover between $40 and $360. However, the price could move above the $360 target with the head-price range still in sight.
The steep-level of the neckline shows that the price can move rapidly on the upside or the downside. Prices shot up from a low of $44 on February 23, 2021, to $200 at the beginning of March 2021. Additionally, prices declined close to the prior trendline before the formation of the left shoulder. Such an occurrence shows that the price will (in most instances) hit the highest price point attained by the left shoulder (see figure 2).
Step 3. Wait for the price to confirm the motion
A glance at the head-and-shoulders top pattern would make the trader opt to short the stock. From the outset, this pattern prepares the trader for a bearish reversal. However, observing the neckline movement and the support level will help in understanding that the expected reversal is on a short-term basis. The confirmation price in the case of figure 3 is close to $87.
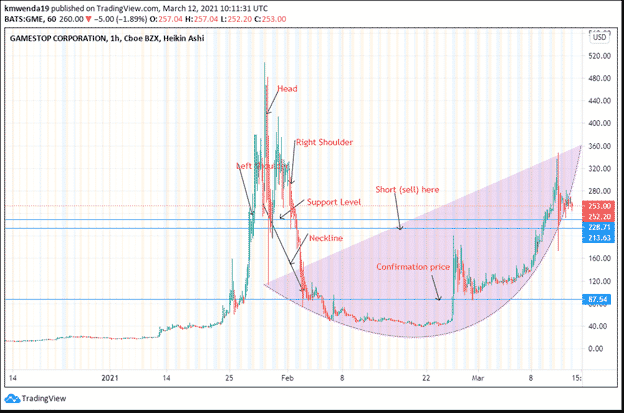
Figure 3: Price confirmation
For a bullish consideration, it was important to buy the stock at the confirmation price, which in the case of figure 3 is at $87.54. At this point, the stock is moving in tandem with the prior trendline just before the bullish pattern was confirmed until the formation of the left shoulder bump.
In case of short selling, you will short the stock once it crosses the $213.63 mark. This position is the lower of the two troughs that form the head-and-shoulders top pattern. Further, it will confirm the stock has hit a resistance level.
Conclusion
This article explains how to interpret the head-and-shoulders top chart pattern. It describes price movement in a bearish reversal. The GME stock chosen for this article had a steep neckline that indicated a steep movement of the price up or down. After it hit the prior price trendline (price before the formation of the left shoulder) it rose sharply. Understanding the price target will help in analyzing the pattern.
