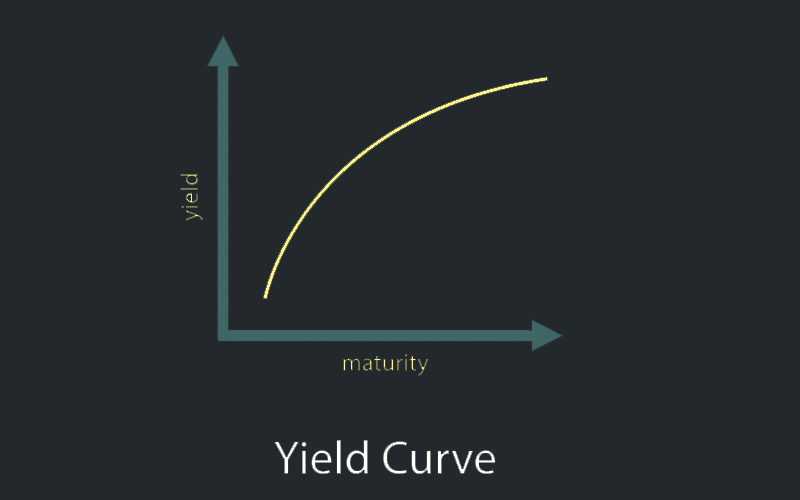
Yield curves are chart plotting of bonds, bills, and notes issued by governments through treasuries as a factor of interest paid over time. When studying yield curves, investors are usually interested in the shapes created by the time-interest trend line because of their implications on the performance of the economy.
Yield curves are presented on graphs, with the X-axis representing time and Y-axis showing interest rates. They are simply presentations of how much the issuer (Treasury) has been paying bondholders in interest. It covers both short-term to long-term bond maturity periods. Due to forces of inflation, governments typically pay higher interest rates as time goes by. However, several factors often come into play and change things.
Due to their underlying impact on economic performance, including effects on inflation and borrowing, bond market interest rates are critical decision-making tools for investment. This, therefore, means that you do not need to have bought treasury bonds to be interested in yield curves. Ultimately, these curves determine how easy or difficult it is to obtain a bank loan, how likely you are to get a buyer for your real estate investment, how much you will pay in the mortgage, etc.
The yield curves of the US Treasury are particularly watched keenly not only by investors within the nation but also elsewhere around the world. This is because of the stake held by the US economy in the global economy performance. To a large extent, the yield curves of major global economies such as the US, Eurozone, China, and Japan can indicate when we are about to get into a global recession or boom.
For investors, tracking yield curves is a good way to prepare before venturing into a market. This can be done by comparing the difference between the yields in one country against the other. This difference is called a “risk spread.” This is because the higher the interest paid by a given country’s treasury, the higher the risk of default. More stable economies generally pay lower interests. This also applies to corporate bonds, whereby they are divided into investment-grade and junk-status bonds.
Types of yield curves
As discussed above, yield curves have an intrinsic meaning that communicates the general health of the economy. Below are the main types of yield curves.
The normal yield curve
As you may infer from the name, this is a yield curve formed when things are calm as opposed to volatile. It rises from the left to the right-hand side, indicating the general belief that governments will be willing to increase interest payments over time. This is also in tandem with the conventional belief that economies are generally expected to grow within “normal” margins.
A divergence in the curve from the left-right ascent trajectory is usually a signal of not only “abnormal” changes in interest rate payments but also looming shifts in economic growth.
Humped curve
As an economy moves towards a slowdown heralded by an inverted yield curve, there is usually a transitional period during which interest payments on long-term and short-term bonds are nearly the same. This leads to the near-flattening of the curve, creating some sort of a hump. This, therefore, means that flat curves/humped curves are also a signal of an impending slowdown in economic performance.
Steep curve
This curve is usually a precursor to steady economic growth. During these times, short-term bondholders find themselves in positions of relatively low interest rates, caused by the previous period of economic lag. As the economy picks up, inflation becomes a big concern to holders of long-term bonds. This usually makes them demand higher interest payments to cushion them against possible inflation. This sends the yield curve towards a steep ascent.
The inverted curve
This is a somewhat weird curve. It is formed when long-term holders of bonds are convinced that interest rates are likely to come down, going forward. With that in mind, they are usually willing to take the current interest rates with little haggling. They, therefore, take higher interest relative to the incoming lower rate of economic growth or even a contraction. This, therefore, leads to the formation of an inverted yield curve. Based on the scenario presented, this type of curve is usually interpreted as signs of potential economic slowdown or recession.
Yield curves as investment tools
As discussed above, we can deduce a lot about an economy based on the trajectory taken by its yield curve. Depending on the information relayed by the yield curve, you can decide if a particular investment idea is good or bad. For example, if the yield curve says that the economy is about to accelerate, then you should consider investing in stocks of luxury goods companies. If, however, the information communicated is of a possible economic downturn, you should turn your attention to manufacturers of basic consumables.
Bottom line
Yield curves are reliable and time-tested indicators of economic performance. They affect the economy beyond the bond market. Understanding the implications of particular curve formations is key to making the right moves with regard to investment.


