The markets have been full of contrasts these days. While major stock indices continue climbing higher pricing in stimulus narrative, forex remains in the risk-off mode.
Investors are fearful and flock to safe havens, where preferences shift too. Read on to discover potential risk-off outperformers, and let’s park that money wisely!
Stimulus narrative, US data, and DXY
Fed remains quite dovish overall, although some members such as Bostic and Rosengren leaned toward early tapering.
The excess liquidity in USD is today’s reality. However, before dumping greenback, markets want to have a catalyst to figure out what to buy instead. The $1.2 trillion infrastructure bill plan has been around, but it wasn’t always gloomy for the USD.
It seems that the initial bill announcement has already been priced in, so when the Senate finally passed it on August 10, there wasn’t much astonishment in the markets anymore – DXY kept drifting higher until the economic data releases.
Dollar reacted wildly to the Core CPI (MoM) (Jul) data on August 11, posting 0.3% vs. expected 0.4%, and previous 0.9%.
If inflation is slowing down, is it a sign that the Fed will reconsider early tapering? The updated 4.3% yearly CPI is way above the Fed’s target of 2%, so such a downtick in monthly inflation shouldn’t make much difference, but dollar bears think otherwise.
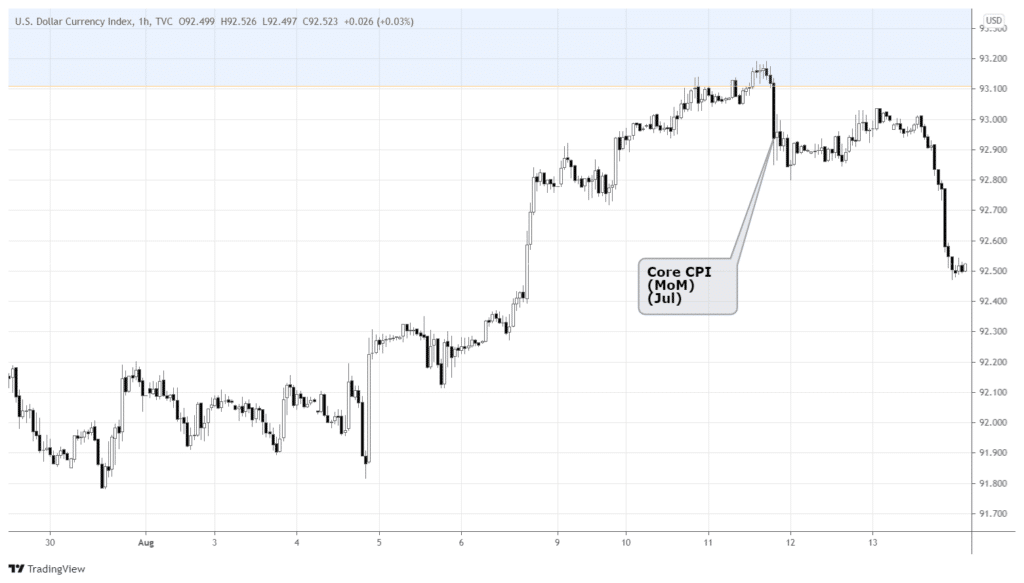
DXY was already vulnerable, approaching the 93.1-93.3 long-term resistance area. The CPI data stood as a catalyst to start the rebound from the critical zone (see the blue area in the chart above).
Overall, the dollar still looks strong, as DXY is consolidating below the upper border of the 90.0-93.0 channel.
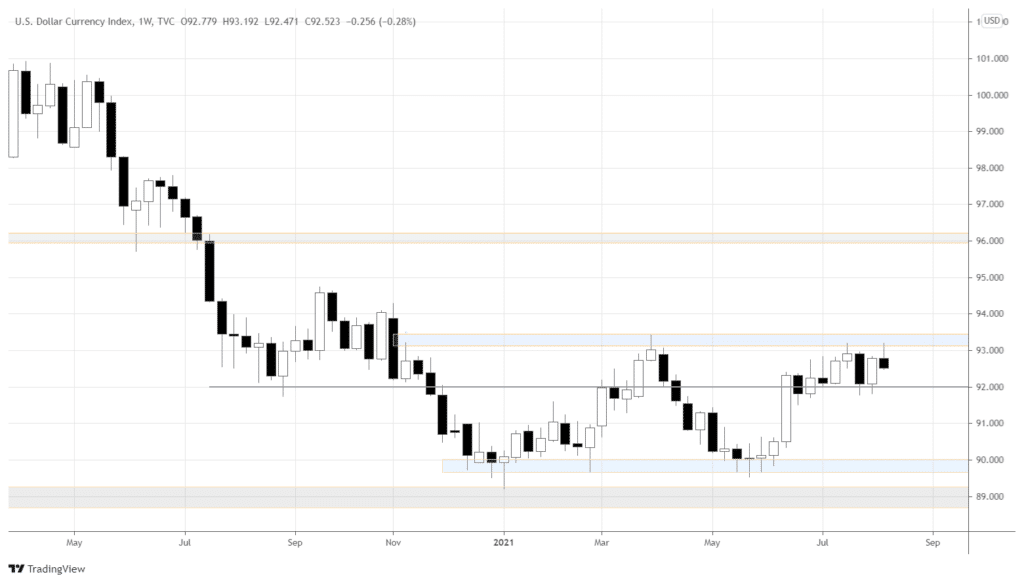
If we are above 93.0, the dollar index is likely to continue moving to 96.0. However, if the week manages to close below 92.0, the USD is in trouble.
Why It makes sense to buy gold
Gold made an impressive comeback from the crash last week.
Look at that amazing hammer candlestick pattern on the weekly chart of gold!
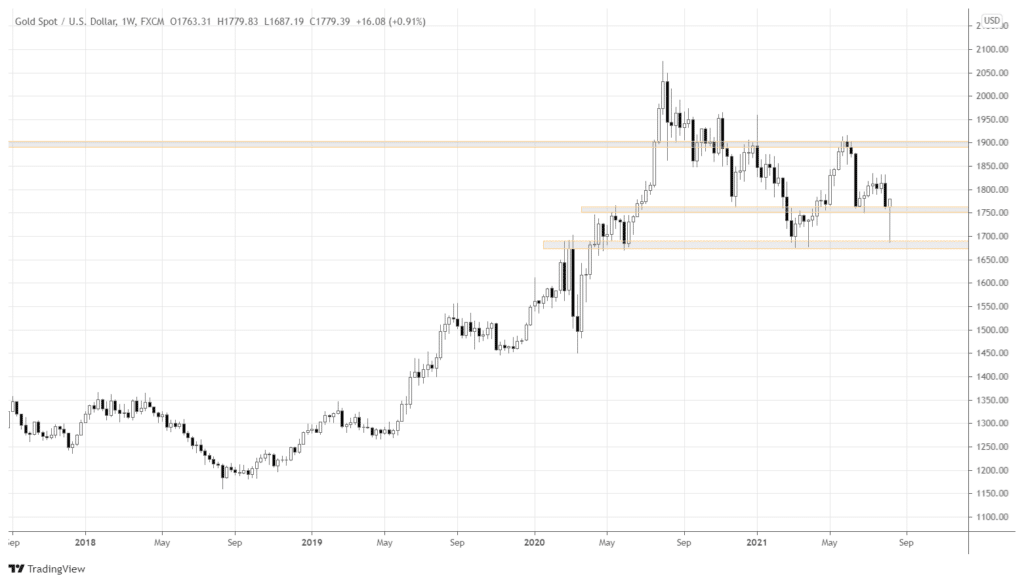
The fact that the hammer bounced off the key support 1700.0 and even closed above another important level, 1750.0, makes a strong bullish case for gold. Add to that dollar depreciation concerns over various stimulus packages, the spread of Delta variant, and you got the environment that favors the bullion.
The odds of reaching 1900.0 in the next few weeks are pretty high, so you might keep an eye on gold.
CHF is such a safe-haven
The risk-off sentiment persists in forex, but investors’ focus shifts to CHF, especially after the 0.5% increase in Swiss PPI (MoM) (Jul) vs. previous. 0.3%.
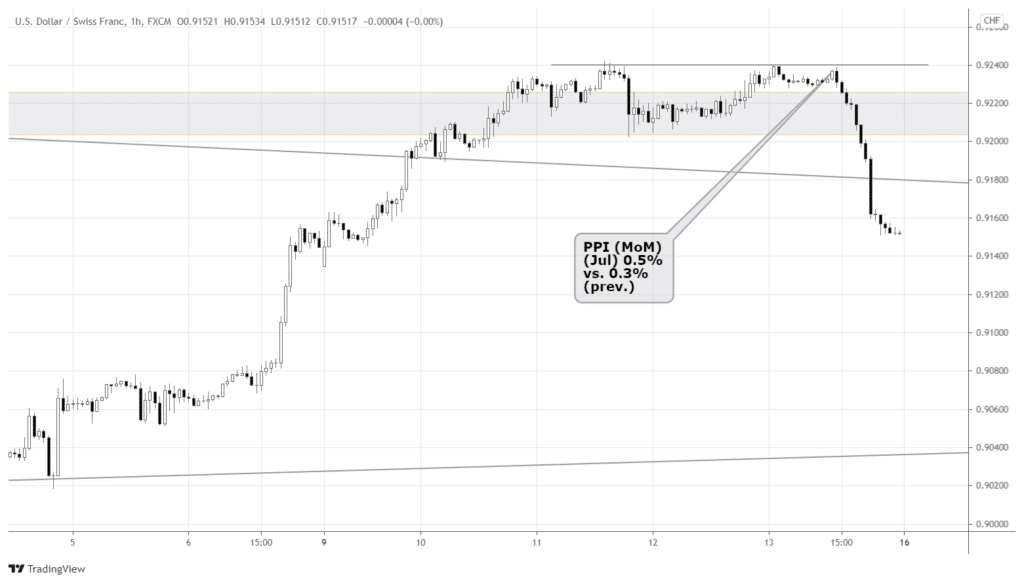
Usually, Swiss PPI isn’t such a powerful market-mover. Still, in the environment of the uncertainty around the blur timing of Fed’s tapering, investors might reconsider what safe-haven currency to buy. CHF is another good option to preserve the value.
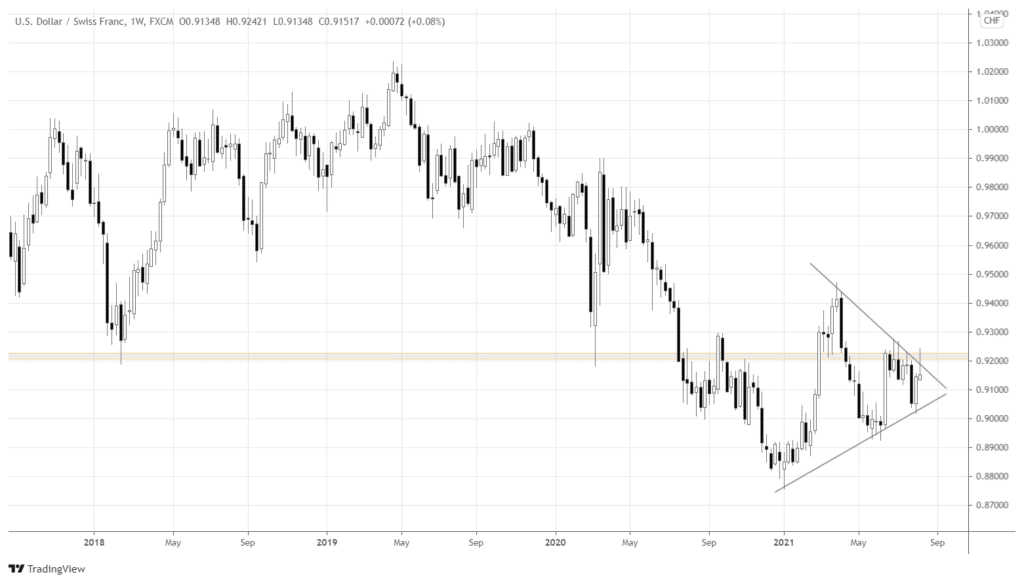
If we zoom out to the weekly chart of USDCHF, the upcoming strength in CHF may get even more convincing. In the chart above, the pair attempted to breakout upward from the symmetrical triangle and 0.92 resistance level but sharply rebounded, forming a hanging man patten – solid bearish signal.
Let’s look at the franc against another potential safe haven, CHFJPY.
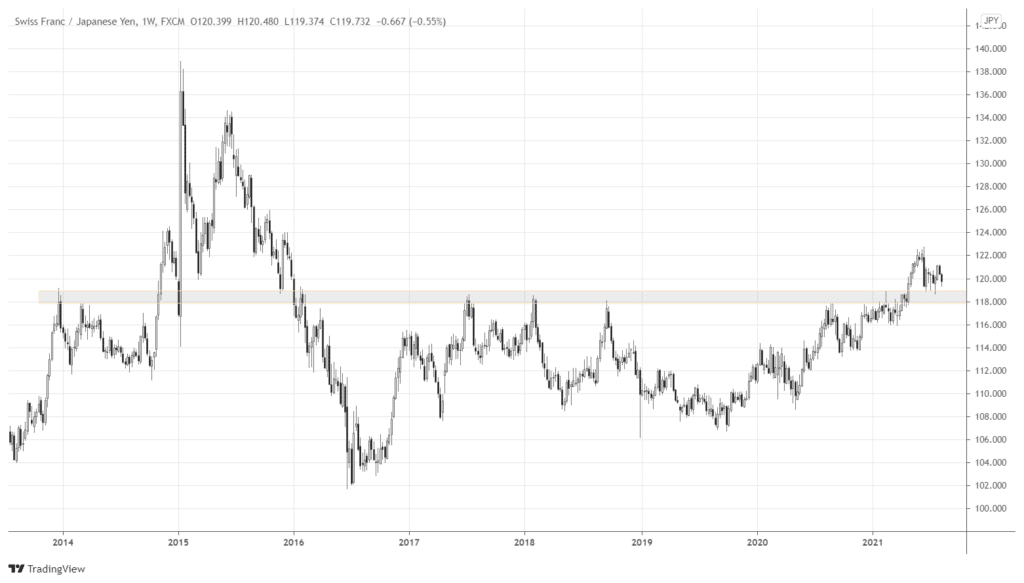
In the weekly chart above, the pair has been in the uptrend since the middle of 2020 and recently broke above the 118.0 super-resistance. Now the pair is retesting the resistance-turned-support. As long as the price is above 118.0, CHF is the safe-have to hold.
Finally, the Swiss franc index summarizes the strength of the currency across the board. Below is the daily chart of SXY.
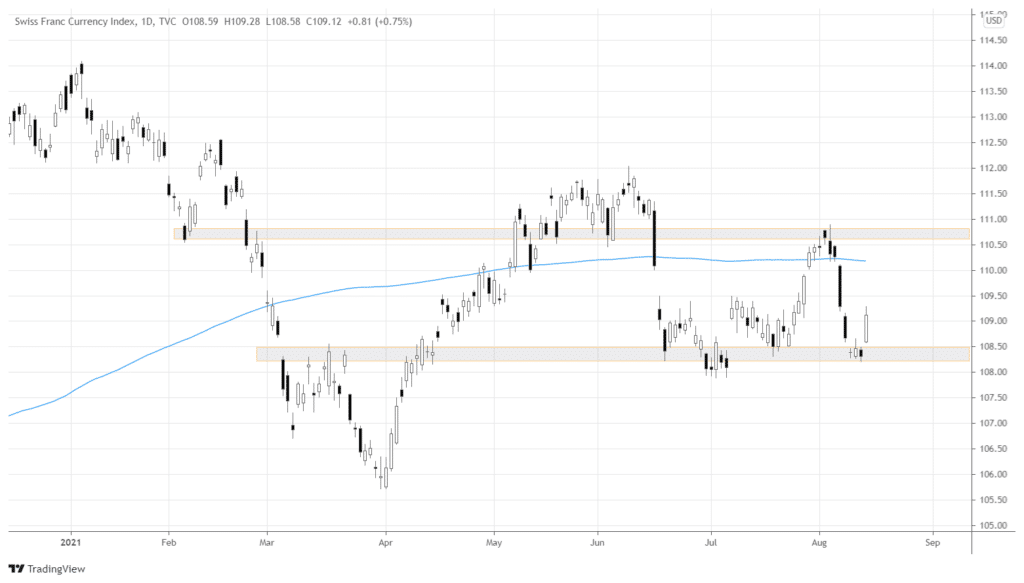
The index skyrocketed on Friday, rebounding from 108.5 support. The logical target would be around 110.0-110.5, near the 200-day Moving Average and 110.5 resistance.
Conclusion
The USD is losing steam due to fundamental and technical reasons. Instead, investors’ focus shifts to the alternative safe-havens: gold and Swiss franc. Traders may take advantage of bullish setups in XAUUSD and CHF-related pairs in the upcoming week.


