The major markets haven’t been fascinating for the last two weeks as they digested gains of the beginning of November. Although most of the Indices have broken out on November 24, there isn’t much momentum in stocks yet to sustain the further move, so we’re back in the sideways mode.
In my view, the Forex market remains unattractive for short-term traders, as the price action is choppy and the volatility is in a downtrend.
What does DXY say about the global sentiment?
As I’m writing this, the Dollar is stepping further into bearish territory. Looking at the chart of DXY below, the Dollar Index finally managed to get through all of the supports and is currently trying out, moving further below the final critical price level – 91.75. I’m pretty bearish on the USD at this point.
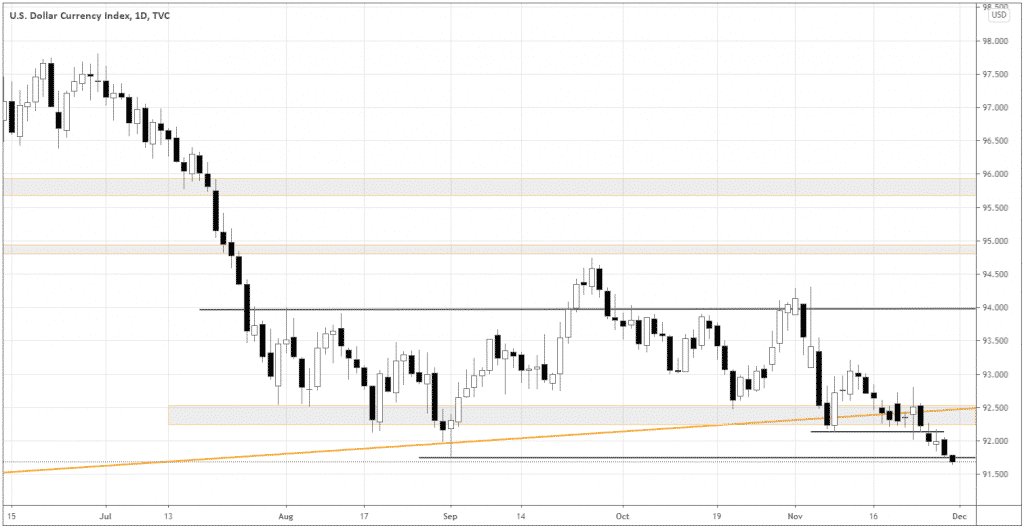
If the Index closes below 91.75, the chances are high that we’re witnessing the confirmation of the bearish trend in the Dollar.
You should consider the trade idea again in USDCHF if you got discouraged after the first fake breakout at the end of the US Election week.
Why Asia?
It seems like we’re witnessing the trend reversal in the relative strength of the Asian markets. Below you can see the charts of the ratios of EEM (Emerging Markets ETF) versus SPY (S&P 500 ETF) and EEM versus German index DAX.
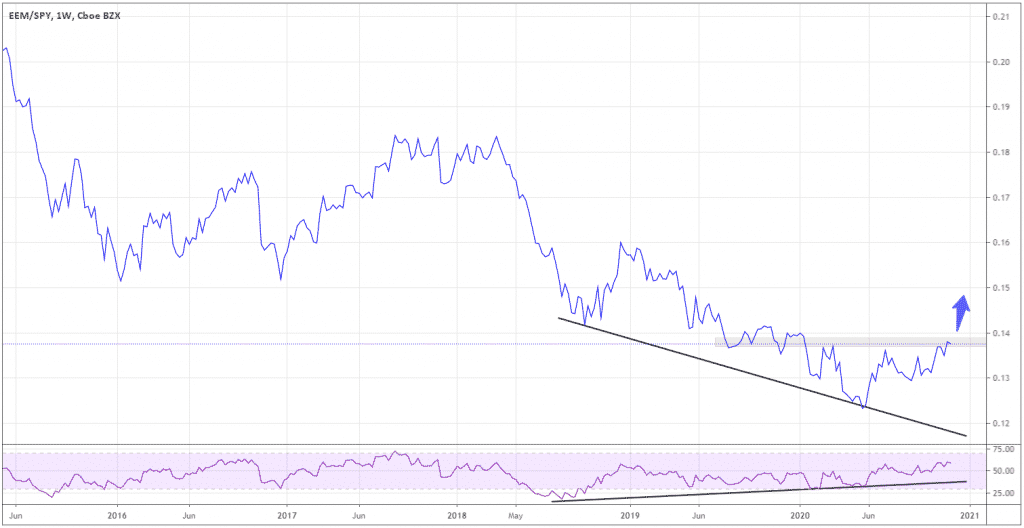
In the chart above, we can see that the ratio has formed a possible trend reversal pattern, as it keeps testing the recent resistance (a grey area). At some point, the breakout may occur, providing the initial momentum to buy the equities of the emerging markets, many of which are from Asia.
Also, you can see the momentum divergence that I marked with the inclined trendlines. While the ratio makes new lows, the RSI shows higher lows.
The EEM versus European markets (which I represent through DAX) shows a similar picture. Look at the chart below.
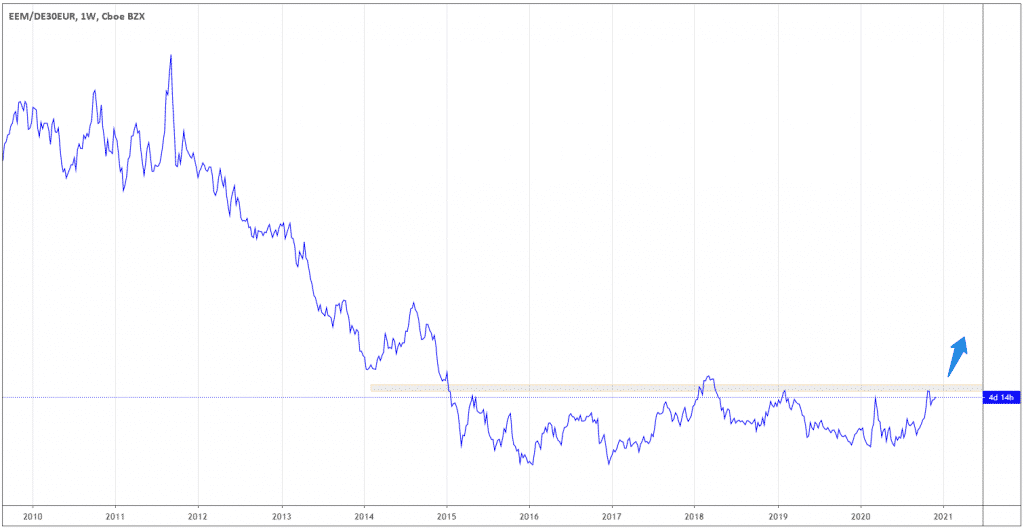
The ratio has been staying in the range for the last five years, recently attempting to test the upper border (a grey area). If it pushes through the border and stays above, the Asian markets would likely be in favor of a considerable amount of time.
The potential of Mainland China
China remains the most probable locomotive of Asian economic growth. Being extremely successful in coping with the current pandemic, the People’s Republic managed to achieve fast economic recovery, being the only country with positive economic growth in 2020, according to the IMF report. The economic indicators like retail sales and Industrial production showed the actual results above the forecasts.
The government drives the economic recovery by more fiscal spending, tax relief, reduced reserve requirements for banks, and lower interest rates.
While the West is struggling to come to its senses because of the pandemic, on November 15, China started leading the world’s biggest trade bloc, partnering with Southeast Asia, Korea, and Japan. The newly formed Asian bloc totals 26T$ in GDP value. China’s intent to build the “digital silk road” is a further extension of the cooperation that will benefit China and the member countries.
You’d also want to keep an eye on Nikkei 225, as the lifted trade barriers will stimulate the Japanese economy just as much!
How to get exposure to China?
As China takes the position of power, I’m considering buying opportunities with exposure to Mainland companies. One of the best instruments to get exposure to Mainland China is the China A50 Index.
The Index made the new all-time high today. Living “its own life,” China A50 is less correlated to the major world indices, which is quite rare, providing portfolio investors with great diversification opportunities. According to the market strategist Paul Colwell, it’s reasonable to have up to 20% invested in China.
Technically the Index also looks attractive, currently offering new entry opportunities for patient traders. In the chart below, you can see that after making a new all-time high, the market sharply pulled back.
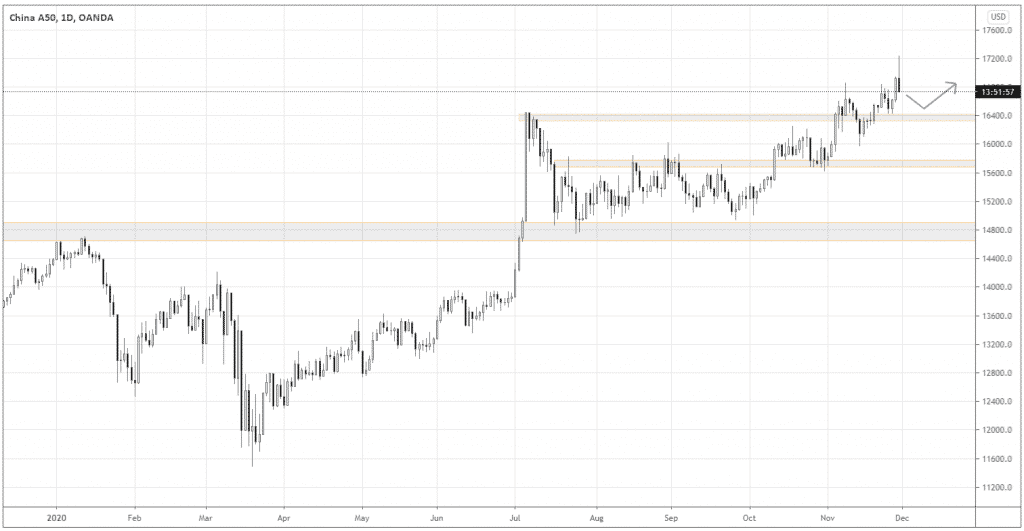
The Index is heading down to the support around 16,400 for a possible retest. I expect a price action signal beside the support to buy the Index.
Summing up
We’re witnessing the change in sentiment turning into the stage of risk-seeking as the Dollar shows vivid signs of the upcoming bearish trend. Emerging Markets are getting the relative strength against the Developed Markets, with China staying resilient in the face of the current pandemic. China A50 index is an excellent opportunity to gain exposure to Mainland China and ride the wave of economic recovery.
