At first glance, the US economy is getting back on track. The labor market is recovering as Unemployment claims decreased again last week, posting better than expected results. Positive readings in Flash Manufacturing and Service PMI in the US and Europe also support the narrative of the economic recovery.
However, Biden’s proposed capital gains tax hike is now weighing heavily on the US stock market.
Let’s compare the US indices with the European and Chinese ones.
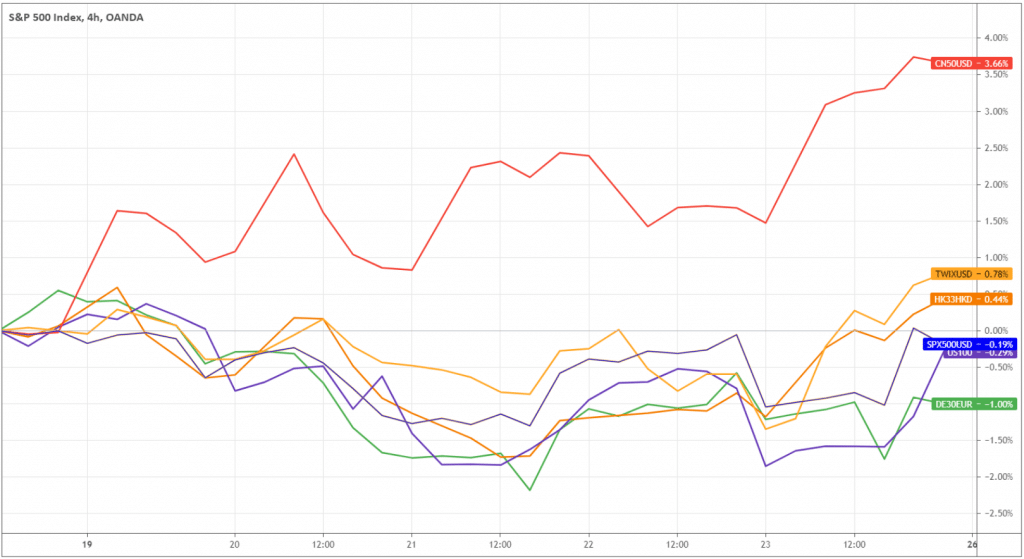
Weekly performance shows that Chinese indices went ahead of the Western ones. Although S&P 500 and NASDAQ-100 (blue and purple in the chart above) outperformed German DAX (green), Chinese equities were consistently ahead, whether it’s Hong Kong (HK33HKD), Taiwan(TWIXUSD), or Mainland (CN50USD).
The red one (ChinaA50) stands out particularly, and we’ll get back to it in a moment.
For now, I suggest you be careful trading the US markets. Here is why it’s risky to have the US exposure now:
1. Strength in bonds and gold, indicating investors’ pessimism about US stocks.
2. Huge funds outflow from QQQ (ETF that tracks NASDAQ-100) over the past five days.
3. Based on the technical analysis, the US indices are overextended.
Let’s look more in detail at the technical factors. Below is the S&P 500 index daily chart and applied three popular indicators: RSI, Stochastic, and MACD.
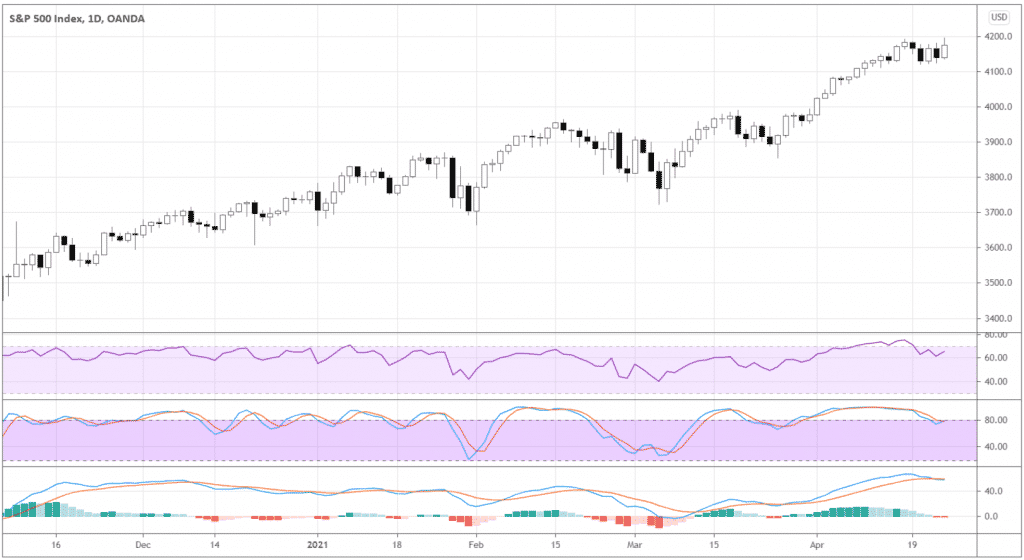
RSI and Stochastic have reached the overbought zone and declined afterward. The MACD also shows fading momentum as the MACD line (blue) crossed below the signal line (orange).
Notice that every time the indicators showed such turning points vividly for the last five months or so, the market corrected.
ChinaA50 outperformance
With all the controversial issues around China, let’s not forget its economic resilience during the pandemic. According to projections of IMF, the spectacular 8.4% growth is awaiting China in 2021.
That’s of the big picture. Now let’s get down to what’s happening in the markets.
After a deep nosedive, Chinese markets are back under the radar as they revived last week.
ChinaA50 gained 3.66% last week. The daily chart below shows how the price nicely bounced off the 16500 support area.
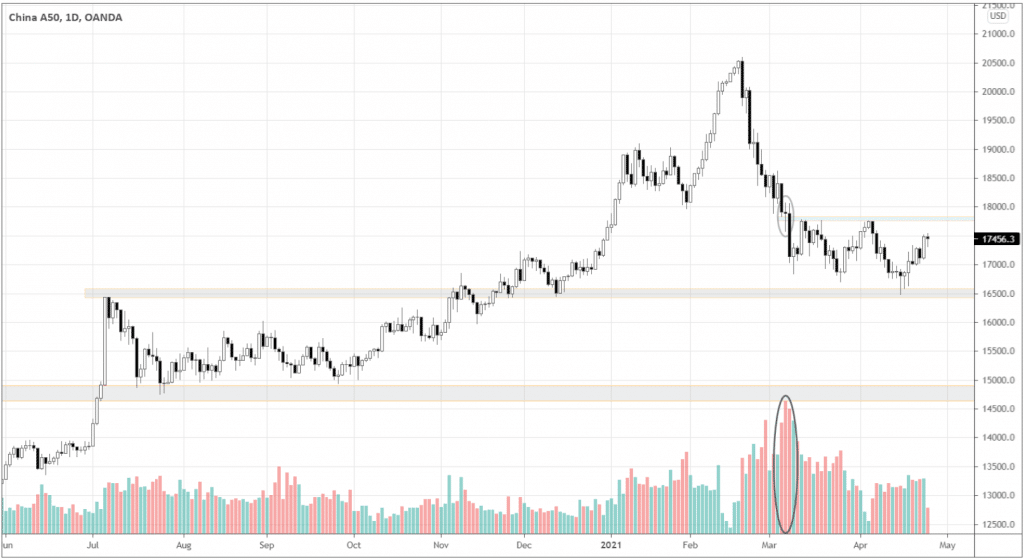
If the market breaks above the area around 17800, we may have good odds of the powerful upward momentum. Look at the volume splash (see circled candles and the volume indicator) when the market broke below the level. This indicates that 17800 is an inflection point.
The move potential is very attractive. We can expect the market to reach 20500 if the breakout of 17800 is real. Rebound traders can already test the waters buying around the current prices with the protective stop below 16500.
Digging deeper – Chinese individual stocks
For those curious about what has been lifting up the ChinaA50 index recently, I got some good news for you.
It’s alcohol.
Yes, Chinese people like drinking local vodka. It’s called Baijiu.
No joke, two of the index weight leaders are Distillers & Vintners. Kweichow Moutai and Wuliangye are totaling 18.23% of the index.

Look at their charts below in the right and left upper corners. Both stocks finished the week positive and are testing their respective resistances. If the prices get a hold above those key levels, ChinaA50 may get a boost.
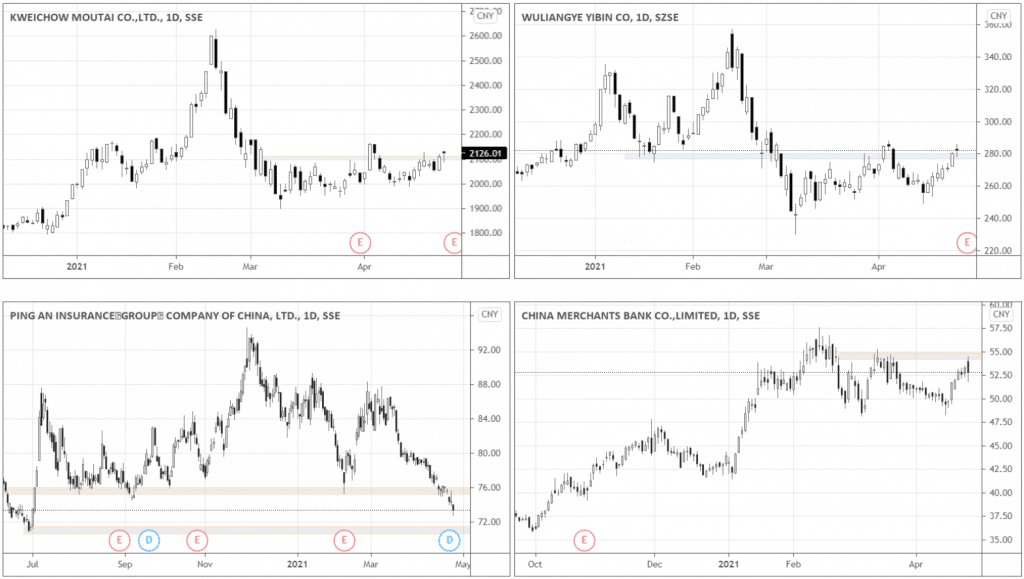
Get ready. The spirit producers will report earnings on April 28th. The releases may serve as catalysts for the long-term up-trend continuation.
Two companies at the bottom are financials. Ping An Insurance is the second most heavy stock in the index, totaling 9.17% of capitalization.
Ping An is crashing, which is surely holding the index back. Expect some signs of rebound near 72.00. I guess any signs of strength would be a huge relief for ChinaA50.
The drama around Huarong solvency weighs on the sentiment of financials and might be resolved after the company’s earnings on August 30th.
Some financials are not so affected, though, looking at another index weight leader China Merchants Bank (7.56% capitalization of the index). The stock is in the uptrend and is testing its local resistance.

