
The Forex market has still been figuring out where to head next, calming down after the Elections week and Vaccine news.
Look at the chart below. From the technical perspective, last week (blue area), DXY got confined in the area of a lot of opposing forces around technical levels. Some traders look at the long-term trend (orange line), others look at the general area of the sideways border of DXY (a grey area), and the short-term traders plan their trades based on the local price levels (horizontal black lines). Therefore, there are many different opinions of where the market should go without definite borders for everyone to consider unanimously.
What’s the moral of the story? Stay away from this kind of market! It pertains mostly to trend followers and momentum catchers. It’s just not worth the risk.
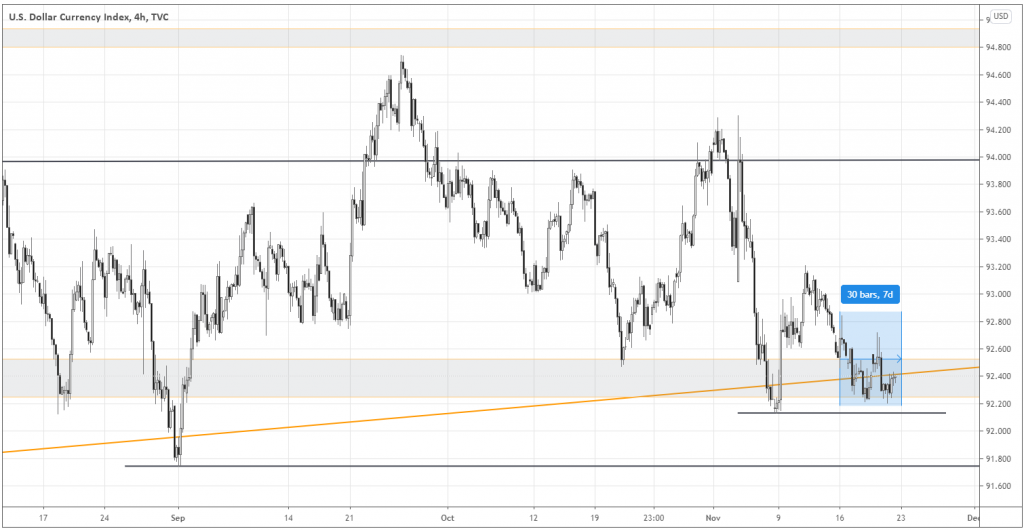
Stay vigilant, though. The longer and more tedious the range is, the more dramatic the trend proceeds! Every day can be the beginning of the new market phase. Be professional; set your alerts at the possible key levels such as 92.1 and 91.75. Wait for the market to come to you!
New opportunities from DAX
While the Forex market doesn’t seem attractive nowadays, such consolidations usually enable the broad markets to generate high quality, big-scope setups. As the follow-up of the previous reversal trade in the relatively strong DAX, let’s look at the vivid setup that’s been forming in the German Index.
In the chart of DAX below, you can see the Index consolidating, forming the nice pennant pattern near 13200, which is the border of the range started in the middle of July.
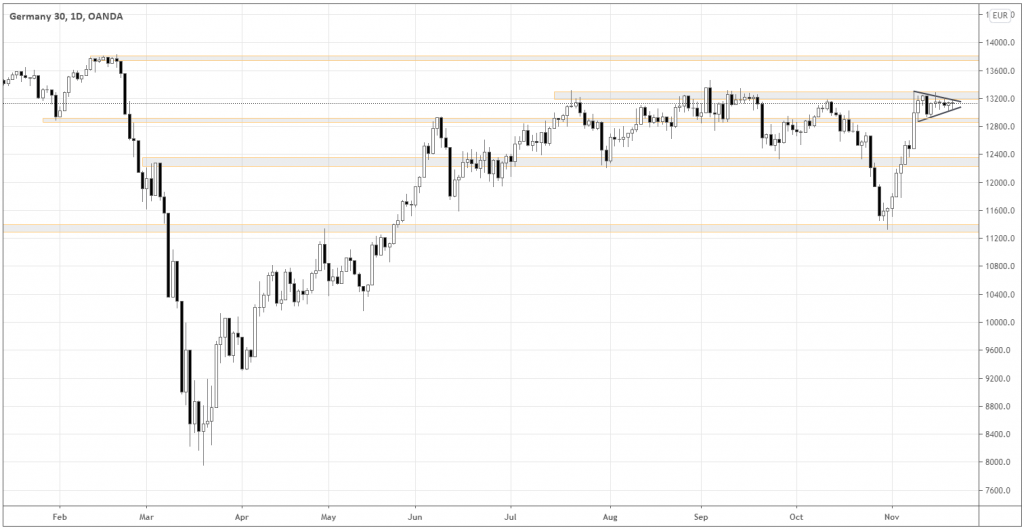
I expect the breakout from the upper border of the pattern (black inclined line) and the subsequent move to the all-time highs around 13800 and likely further to the north.
Of course, it can also break the down border of the pennant, but I’d prefer to follow the trend on a bigger scale. All in all, the pattern can be a trend continuation of the move since the beginning of November, the low in March, and the long-term uptrend that’s been going for over a decade!
To open a trade, we want to see a full-body candle that closes above the upper boundary of the pattern (upper black inclined line). The suitable place for the protective stop is either below the full body candle, which breaks up beyond the pattern boundary, or below the pattern boundary, around 13125. The minimum risk/reward ratio should be 1:3 for this trade.
The relative strength of DAX continues
In the previous setup in DAX, we were talking about the sign of the relative strength of the German Index versus the S&P 500. It seems that the effect continues. In the chart below, you can see the ratio of the S&P 500 versus DAX.
My conservative scenario was that after the move rebounded from the resistance “B,” it would find the support rebounding from the mirror support level “A.” However, the ratio went even further down, breaking the support “A” and retesting it from below, turning it into the mirror resistance.

Therefore, from this situation, we can conclude that the relative strength in DAX versus S&P 500 is very likely to continue, which confirms the idea of buying DAX.
Summing up
There are times in the market when it’s better to step aside and patiently wait until the situation gets clearer. That’s what’s happening in the Forex market right now.
DAX offers a great classical technical setup while maintaining the relative strength against the S&P 500. Swing and intraday traders can take advantage of this setup opening positions after the breakouts occur.


