The market sentiments have been mixed lately. The US dollar – a classic safe haven, slipped, with DXY losing 0.88% last week. Although the major risk-on commodity, crude oil, is approaching this year’s high, the stock indices and risk-on currencies remain sluggish. Last week’s FOMC statement and Powell’s comments seemed rather dovish yet didn’t manage to encourage the markets.
Mixed US metrics, dovish Fed and DXY
It seems the Fed may consider starting tapering in several months. The FOMC statement mentioned there would be “meetings” before further tapering, implying the taper announcement might happen in November instead of September. Additional time gives the markets room for stabilizing, decreasing the odds of shocks and sharp declines.
Last week released mixed economic data. The US economy grew 6.1% in the second quarter amid positive consumer sentiments in July and improved personal spending in June. However, June’s Core Durable Goods Orders and Home Sales data saw a decline. Although the Initial Jobless Claims saw an improvement, they missed the forecasts.
The US dollar index seems to price in the postponed tapering and the uncertainty around the US economic growth, as DXY closed the week negative.
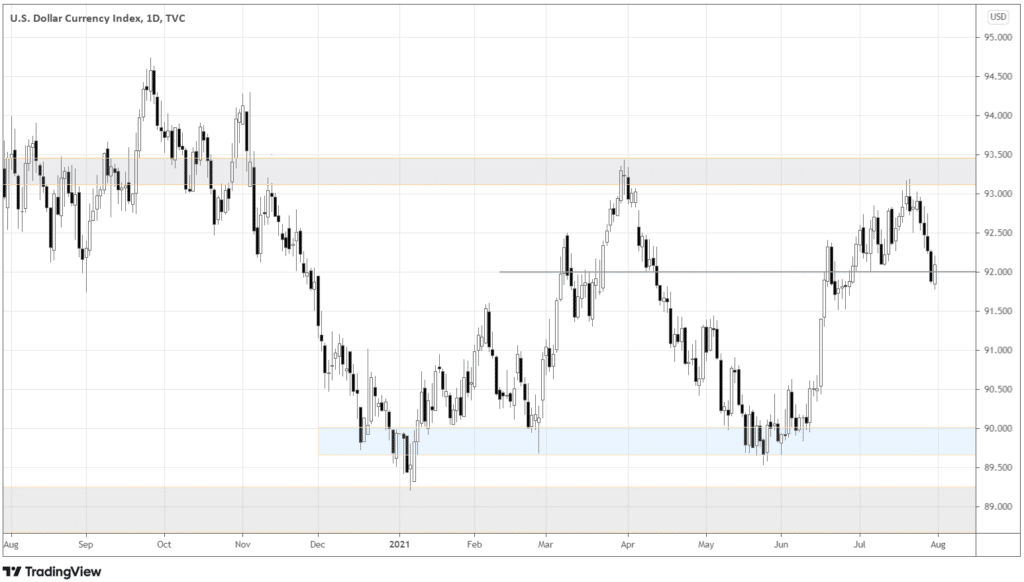
Index stays within the 89.0-93.5 range, bouncing off the upper border last week. The decline stopped around the short-term support of 92.0. Notice, Friday candle closed above 50% of Thursday’s bearish candle, forming the Piercing Line – the bullish reversal pattern.
If you’re a swing or daytrader, you may be interested in the 92.2 level, the breakout above, which is likely to be a trigger for a further surge. A good way to buy the breakout would be at the close of the 4-hour candle that manages to close above 92.2. The aggressive yet reasonable protective stop would be below the trigger candle’s low or even right below the 92.2 level.
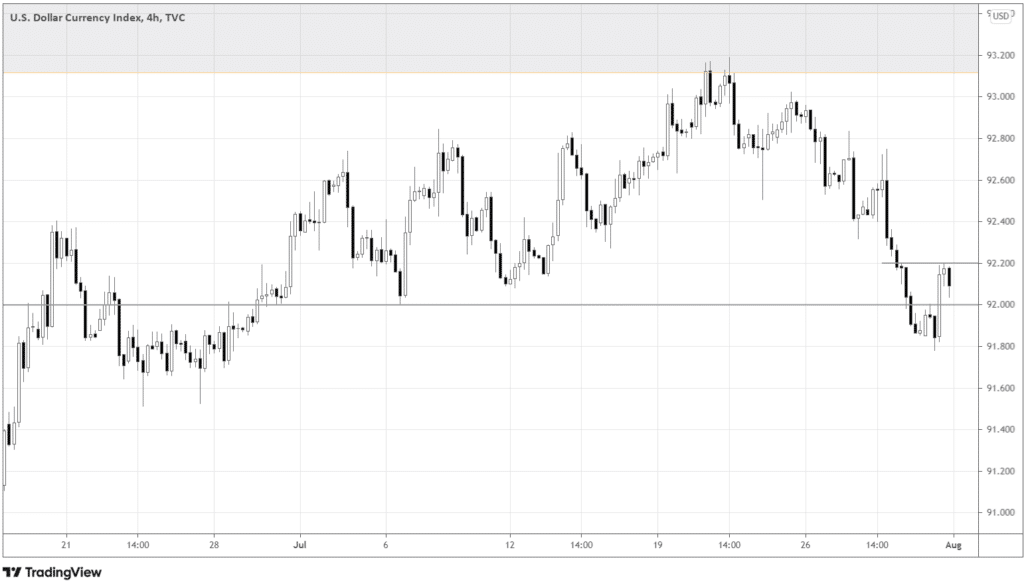
In general, short-term traders attempting to buy the index may enter around Friday’s close, with the protective stop below Friday’s low. The reasonable target would be the resistance area around 93.0.
For those with a bearish bias, I’d wait until the index closes below 92.0. The protective stop may be above the recent upswing, for example, 92.2. The targets of potential short-sell trades would locate in the 90.0-90.5 area.
You can also use the price action of DXY to time your USD related trades in Forex pairs.
How China crashed the market with the ban on private tutoring
On July 23rd 2021, China prohibited after-school academic-related tutoring institutions from doing business and going public. The private tutoring sector is immense in China, totalling $100 billion. Furthermore, the policy banned any foreign investments in the tutoring companies, with the present investors facing uncertain fate about their capital.
Chinese equities still might exhibit some hope before the shock, although the crackdown on tech giants already spread gloom among investors. However, as the indices broke down major support areas of well-established channels, Chinese markets may stay depressed for a while.
High volatility and harshly discounted assets are the time for active traders and long-term investors to step in. Historically, the China A50 index is more volatile than Hong Kong 33 (HK33).
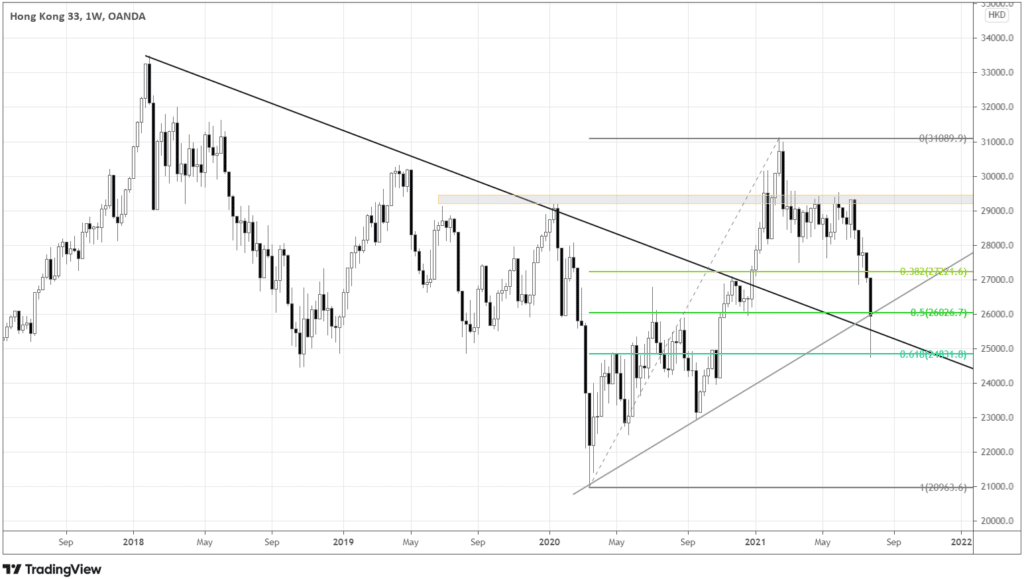
The long-term charts show that both indices are in the critical areas now.
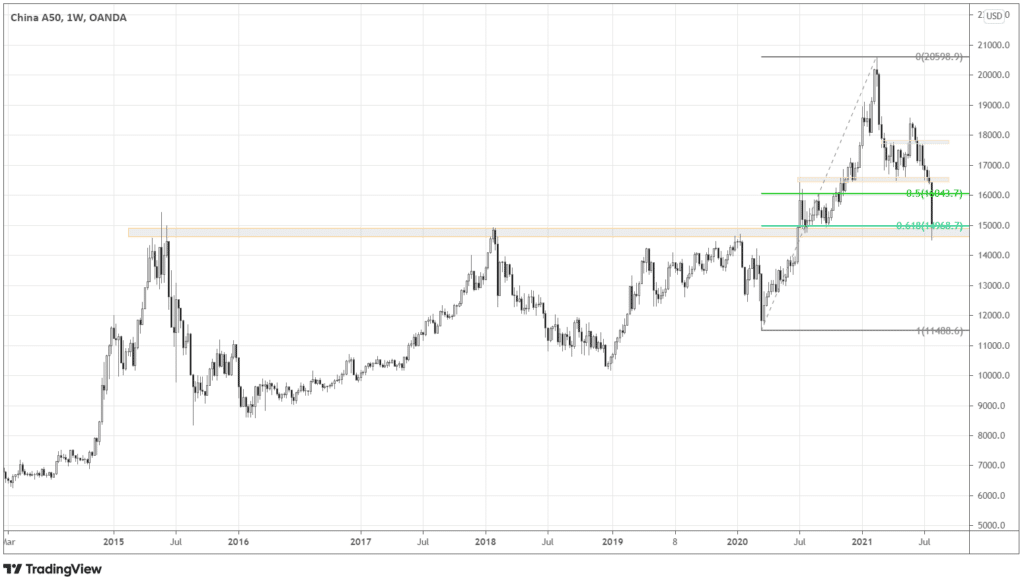
China A50 is testing the resistance-turned-support at 15000.0 and the 0.618 Fibonacci retracement level.
HK33 is now located at the intersection of the two trendlines and the Fibonacci 0.5 retracement.
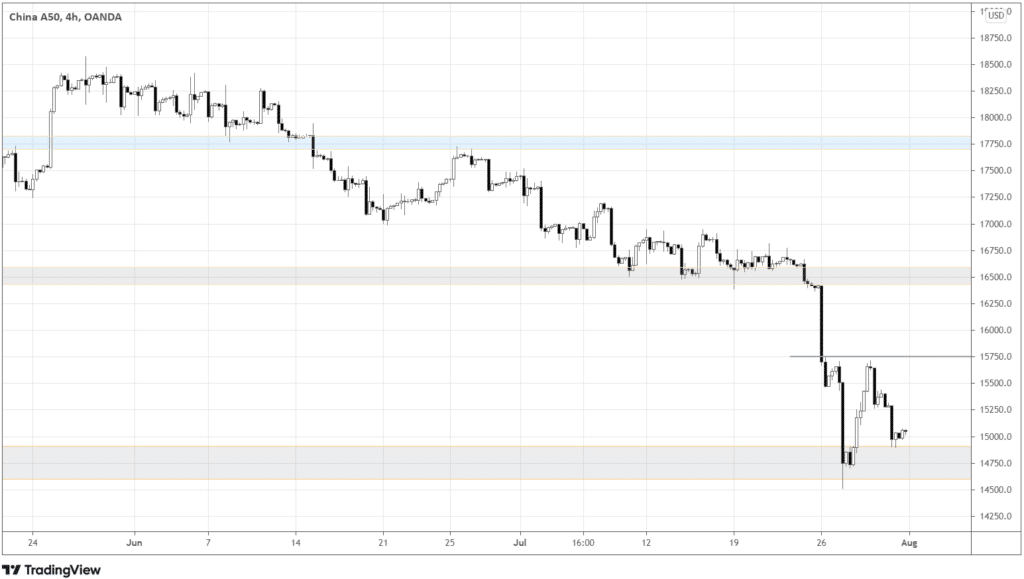
China A50 fell deeper, closing the week further from the last local high and potential trigger-level of an up move – 15750.
The key level for Hong Kong 33 is closer to the current price. Thus, if Chinese equities decide to recover, HK33 should be the index with relative strength.
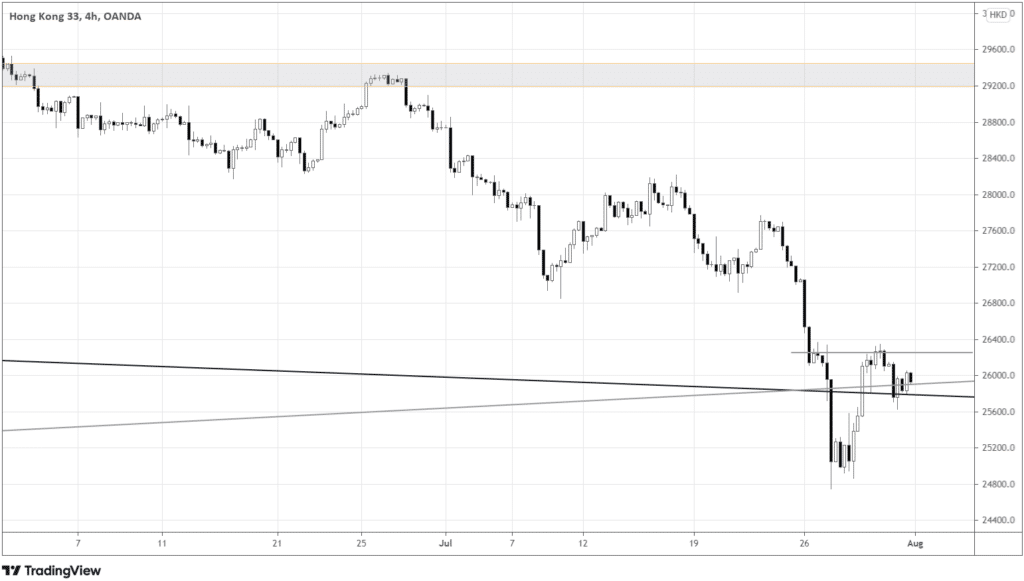
Both indices are overextended and may rebound up from their respective support areas. For traders able to take calculated risks, this is a conducive market environment.
Conclusion
The global risk sentiment is mixed. While the Fed is giving dovish hints, the US dollar still slipped. Due to the new policy, the highest volatility is currently coming from Chinese markets, presenting opportunities for prudent risk-takers.
