Last week hasn’t been the strongest for the risk assets, although indices, risk currencies, and some commodities showed signs of recovery at the end of the week.
The US jobless claims and quarterly GDP data also supported the bullish sentiment for the risk assets. Some say President Biden is considering pumping three trillion dollars in infrastructure that would spur economic growth and pressure Treasury bonds.
During such sentiment shifts, Forex is an excellent place to be in. The currency index below that tracks the relative strength of currencies shows the significant weakness of NZD (see the black line) – one of the target instruments for the risk seekers in Forex.
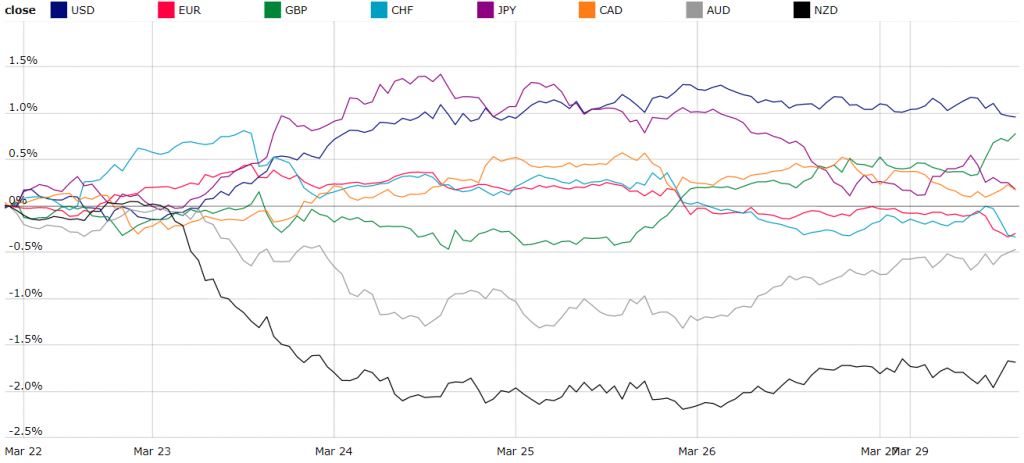
While the closest NZD’s “risk companion” Aussie dollar (see the grey line) is recovering more decisively. The discrepancies in NZD and AUD’s momentum are common, but this time the NZD is dragged significantly behind.
Why so? New Zealand has been staying solid during the pandemic stating only 0.53 deaths per 100,000 population. Read on to dig deeper into what’s happening with Kiwi.
How NZ Prime minister spooked the NZD bulls
While BNZ’s forecasts for higher Kiwi are unchanged, the news from NZ Prime Minister Jacinda Ardern put pressure on the NZD, causing the currency to tumble 2.3% against the USD in a day.
On March 23rd, the Prime Minister announced the cancellation of some tax benefits for real estate investors. The measure aims to restrain the housing bubble as 40% of house purchases are conducted for investment purposes.
NZD technical picture
NZD has been in a bullish trend since the beginning of 2020. The pair has held above the 200-day Moving average and broke the significant long-term resistance at 0.68, pushing to 2018’s highs around 0.74, as you see in the weekly chart below.
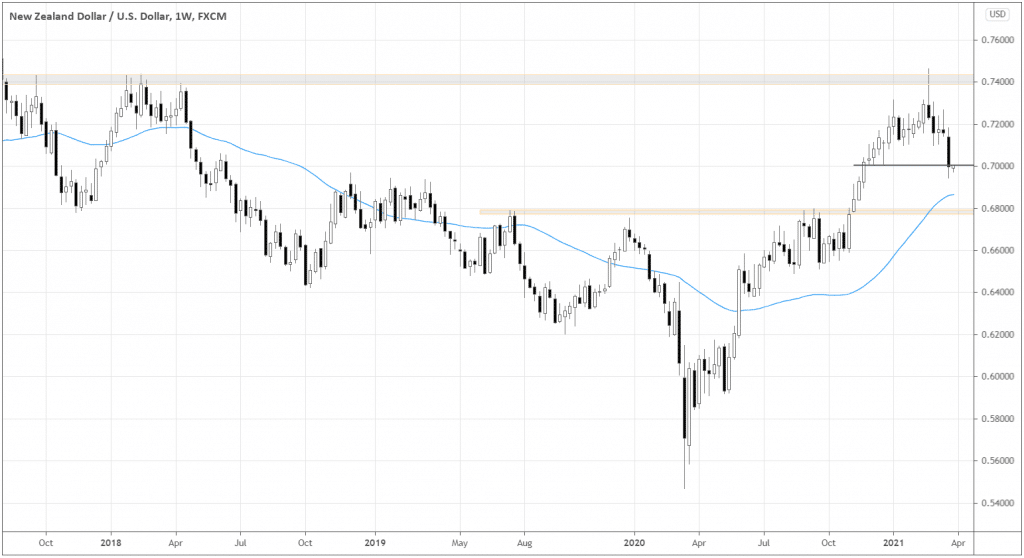
The 7-day lockdown in Auckland contributed to the weekly shooting star candle formation, which pierced 0.74 several weeks ago. From then on, the pair seemed bearish as the candle pattern appeared around the strong resistance area.
Could the market start pricing in the real estate bubble resolution since then? We would never know, but it seems that temporary factors drive the current decline while the underlying NZD’s strength is still in place.
The daily chart below offers some possible technical setups. After a slump below 0.70, traders may buy Kiwi if it holds above 0.70.
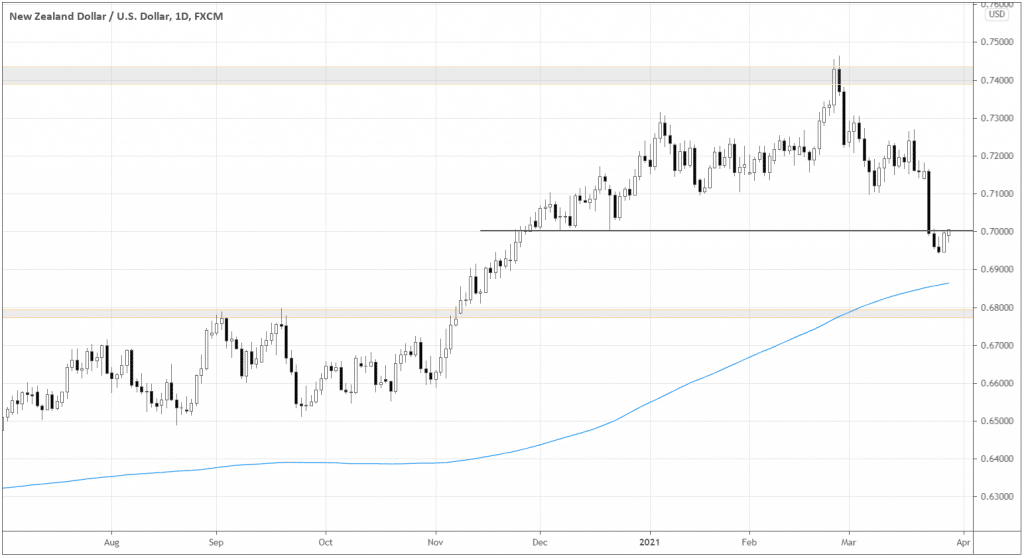
Another scenario would be trading a short-term downtrend continuation, shorting below 0.70, especially if the pair pierces the level and snaps back.
Why necessarily short-term? Look at the 200-day Moving Average and the resistance-turned-support 0.68, which are not far from current prices. The proximity of the supports possibly limits the downside move potential.
Understanding the relative strength with AUD/NZD
Looking at the currency index, we know that the NZD significantly underperformed compared to the AUD for the last week. The technical picture of the AUD/NZD Daily chart below can tell us why and put things into perspective.
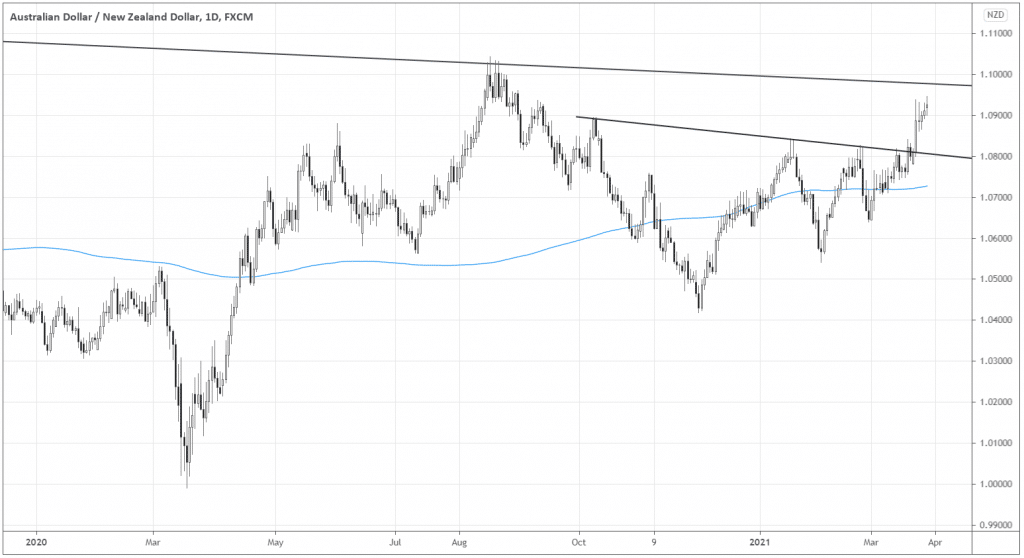
The pair has formed the symmetrical triangle for the last few months until it broke above its upper boundary (see the inclined black line crossing 1.08). No wonder AUD is relatively strong – it experienced fresh momentum after the breakout against NZD.
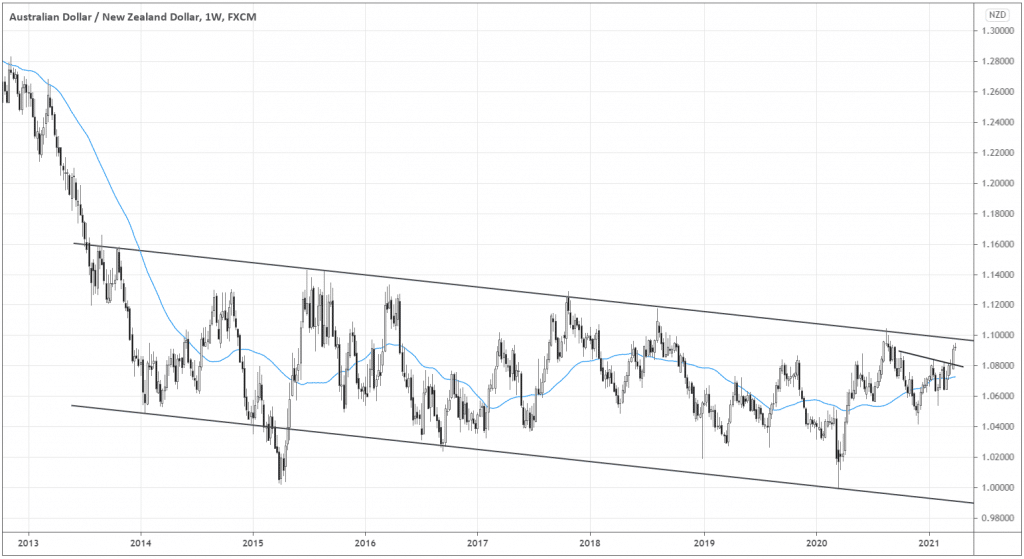
The momentum may stall as the market is approaching the long-term resistance 1.10. The weekly timeframe shows how significant the 1.10 level is.
AUD/NZD has been ranging for the last six years, staying within the descending channel. The upper border this time is at 1.10. We can expect the NZD to start strengthening again as the AUD/NZD rejects the channel’s upper boundary.
Conclusion
NZD may be significantly undervalued due to the bearish sentiments caused by the government’s attempts to curb the housing bubble in New Zealand. The long-term outlook remains unchanged, according to BNZ.
The upside potential of the NZD seems to be bigger than the downside. AUD/NZD gives clues about the Kiwi’s relative strength changes as one of the major risk currencies.


