Stock traders utilize a myriad of technical data, price charts, and indicators to make their selling and buying choices. Traders use these statistics to keep track of numerous stock market movements and shifts in stock prices and stock momentum. In 1967, Richard W. Arms created the Arms Index, commonly referred to as the Short-Term Trading Index (TRIN).
TRIN indicator explained
TRIN compares rallying and declining stocks to rallying and falling volumes. It gives a measure of the market’s supply and demand forces. This enables investors to anticipate future day-long price movements. By signaling oversold and overbought levels, TRIN points out when the stock index and most of the stocks in it will shift direction. Many chart applications have this indicator incorporated. One can also calculate it mathematically.
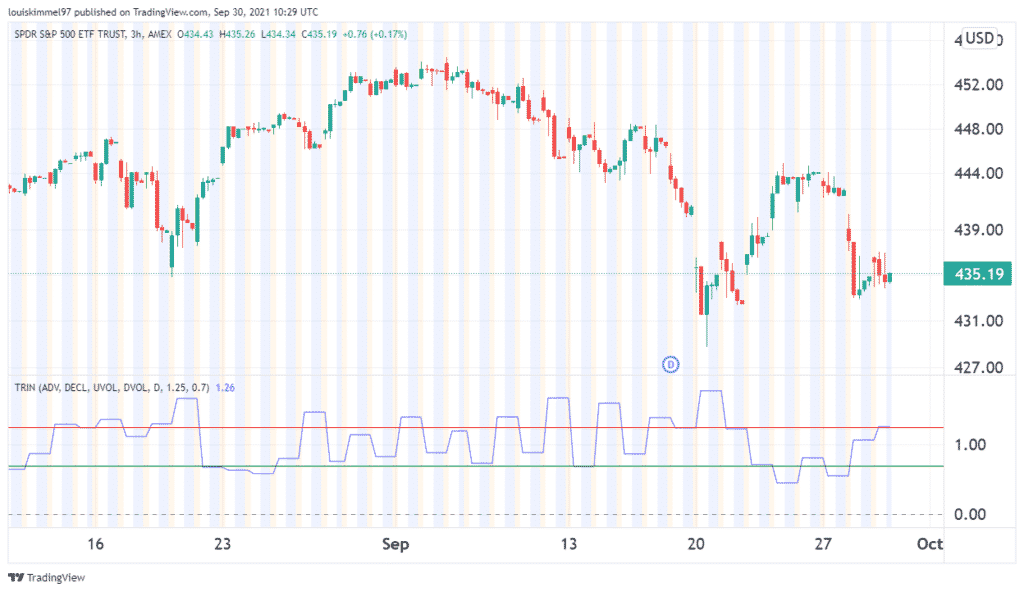
Example using chart application (TradingView)
Because up-volume overwhelms down-volume to provide a relatively high AD Volume Ratio, strong market advances are accompanied by relatively low TRIN readings. This explains why the TRIN appears to move in the opposite direction of the market.

A strong market up day tends to push the Arms Index lower, while a strong market down day tends to push the Arms Index higher.
Calculation
Let’s look at the formula of TRIN below.
TRIN = (Advancing Stocks/Declining Stocks)/(Advancing Volume/Declining Volume)
Advancing stocks: These are stocks whose value has risen from earlier readings.
Advancing volume: It is the quantity of advancing stocks.
Declining stocks: These are stocks whose value has lessened from previous readings.
Declining volume: it is the quantity of declining stocks.
Steps
- Obtain the ARD ratio. This is a ratio of the number of advancing stocks to that of declining stocks. It is calculated in arbitrary intervals, such as monthly or every two hours.
- Find the AD volume. This is done by dividing the total advancing volume by the total decreasing volume.
- Divide the AD volume by the Ad ratio.
- You can repeat the computation for the next interval.
- Plot all of your findings on the graph you made.
- You can see how the TRIN travels after connecting numerous points.
Results analysis
An index value of 1.0
When you get a value of one, it shows that the market is in a neutral situation. This means that the AD volume ratio is equal to the AD ratio. The advancing volume is distributed evenly among advancing issues, as is the declining volume among declining issues.
An index value of less than 1.0
This means that the AD volume is greater than the AD ratio. Due to the high volume of rising stocks, an index value of below 1.0 is typically followed by a big price rise. This indicates it’s a bull market.
An index value of more than 1.0
This means the AD volume yielded a lower value than the AD ratio. Due to the large quantity of declining stocks, a resultant index value above 1.0 indicates a significant price decline. In other words, the declining stock surpasses the average advancing stock in volume. This indicates it’s a market for bears.
Overbought and oversold determination
The TRIN moves inversely to the analyzed index and has a neutral value of 1.0, exceptionally high or low readings in the indicator may show that levels are either overbought or oversold and are due for a reversal. The levels may differ slightly by index, and the TRIN can always give you a heads up. When the TRIN’s value falls below 0.50, this shows that the market can be overheated and overbought. When the TRIN’s value exceeds 3.00, it may signal a market that is oversold and has an overly bearish mood.
Pros of TRIN
- When one analyzes the TRIN calculation, one can gain a better view of market performance and trends by looking at which assets are rising and which are falling.
- The TRIN calculates the ratio of net advances to volume. While most traders focus solely on price change, volume plays an equally essential impact.
- Price changes that are correlated with a large volume have a greater impact than those that are correlated with a low volume. Why? Low volume normally does not result in a major price change, whereas huge volume usually does.
- It gives traders a better idea of what’s really going on in an index.
- The TRIN is a powerful stock movement indicator and prediction. The TRIN’s values function as buy, sell, and hold signals, thanks to its formula. Traders can use these metrics to predict which direction a stock or index will move.
Cons of TRIN
- It isn’t usually accurate as a stand-alone indicator. Traders employ other indicators such as Moving Averages or Bollinger Bands together with the TRIN to double-check the data and reliability of the indicators.
TRIN with (MA) Moving Average
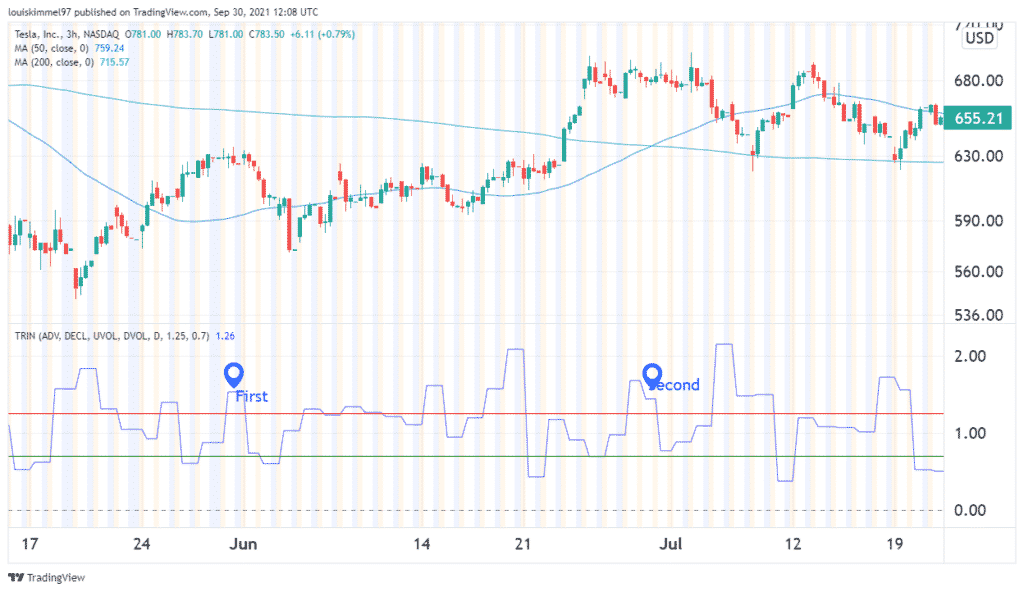
If the TRIN is greater than 1.0 but less than 2.0, it indicates that equities are under pressure and that a short-term fall is imminent.

In the graph above, in the first scenario, the TRIN was 1.56. This signaled a short price correction, as seen. There was a drastic bearish movement. In the second scenario, there was a short price correction too. There was a bearish movement right after. This is supported by the two plotted Moving Averages. The 200-day Moving Average crossed below the 50-day Moving Average, indicating a bearish movement too.
Conclusion
The TRIN indicator can assist investors in understanding price movements in relation to volume. This enables them to make better-informed decisions based on the scope and depth of these shifts. The TRIN can be calculated manually, and there are some charts that have incorporated it as an indicator. The TRIN has a major disadvantage in that it is not accurate, mostly when used alone. That is why it is advisable to use it using other indicators such as Moving Average for better results.
A: The Arms Index, also known as TRIN, is a market indicator that measures the relative number of advancing and declining stocks to advancing and declining volume.
A: Values above 1.0 can indicate bearish sentiment, while values below 1.0 may indicate bullish sentiment.
A: While it provides valuable insights on its own, many traders use the Arms Index in conjunction with other technical indicators.


