Technical indicators are essential trading tools that give out trade signals and help manage current positions. They work based on coded algorithms, much similar to EAs. Many indicators are available in the industry responsible for analyzing trends, momentum, volatility, and support and resistance. We are also able to classify them under the points mentioned above.
These tools are a favorite choice of technical traders who utilize charts for their analysis. Some investors make their strategies on the combination of several indicators. Our article will highlight one of the essential algorithmic tools that have stood the test of time and are a favorite choice amongst top traders.
Advantages and disadvantages of indicators
While there are tons of indicators with individual pros and cons, we can associate a few general to all. The benefits are as follows:
- Emotions. Indicators are practically free of any feelings and work consistently. Removing the element of psychology gives them a massive advantage as it reduces human error.
- Easy. These tools are easy to use as even a beginner can install and understand them without any effort.
- Variety. The wide variety of choices available certainly helps in including them in your strategy for better gains.
- Quick analysis. The best indicators in the markets provide a brief analysis which makes it easier to understand charts.
The demerits are:
- Lagging indicators. Indicators that show only the past view are not beneficial.
- Scams. There are lots of scams on the Internet about indicators that are 100% accurate. Beginners and amateurs fall for them fluently.
What is MACD?
Founded in 1960 by Gerald Appel, Moving Average Convergence Divergence is a popular momentum indicator that follows the trend. There are three input setting for MACD:
- The first input is for the fast length MA.
- The second one is responsible for indicating the slow MA.
- The third is there for signal smoothing formed by taking in the number of bars to calculate the difference between fast and slow MA.
Depending on the closeness of the two moving averages, the histogram contract and expand.
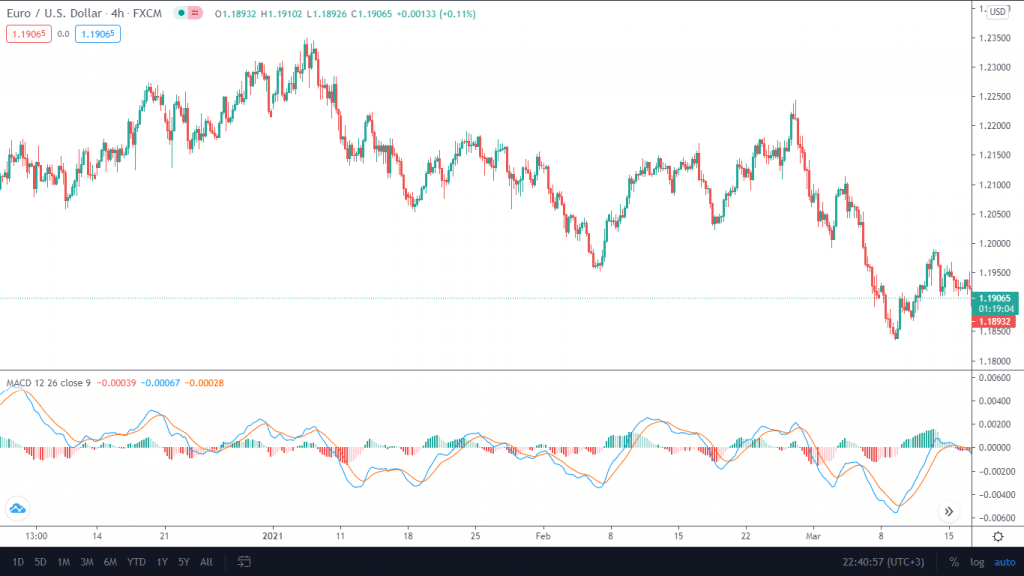
Image 1. MACD indicator on a EUR/USD chart at the H4 time frame.
Using MACD
There are various ways in which you can utilize MACD in your trades.
Trend
You can determine the current trend in the price and potential reversal by looking at the moving averages. If the faster line crosses over, the slower one from the top, it indicates a shift from an uptrend to a downtrend and vice versa. There will be a case of a downtrend if the fast line is hovering over the slow one and vice versa.
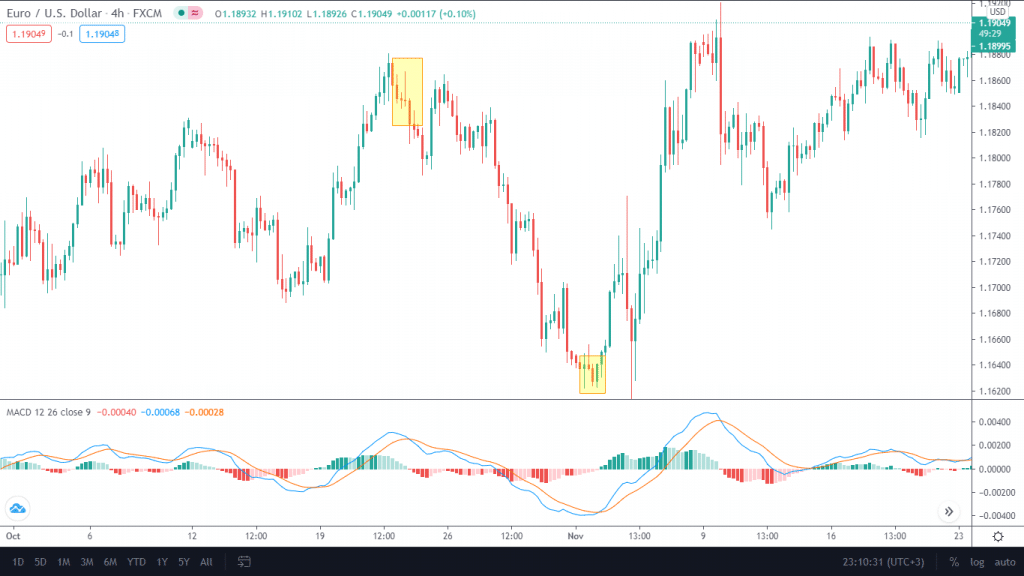
Image 2. A crossover in between the moving averages indicates a shift in the current trend.
Momentum
When you see the two lines away from each other, and the histogram starts imprinting more bright colors with more extensive lengths, the current trend momentum is getting stronger.
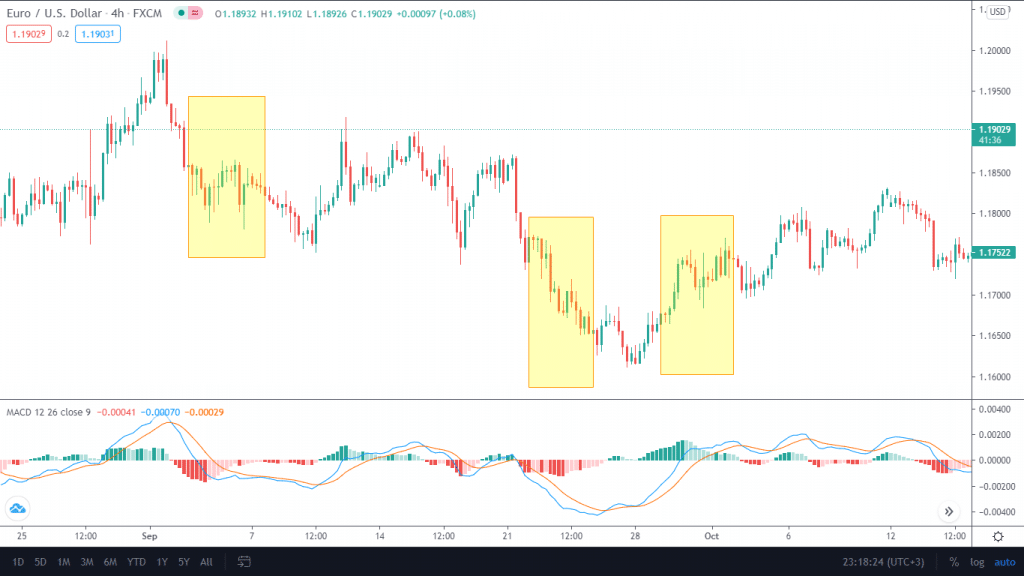
Image 3: The yellow parts highlight the key areas where the market turns bearish or bullish by a significant margin.
Divergence indicator
MACD divergences are a great way to analyze possible reversals in the price. Divergences are available to trade when an indicator creates higher highs and lows while the chart’s price action is doing the opposite. This can indicate that a new trend is in place.
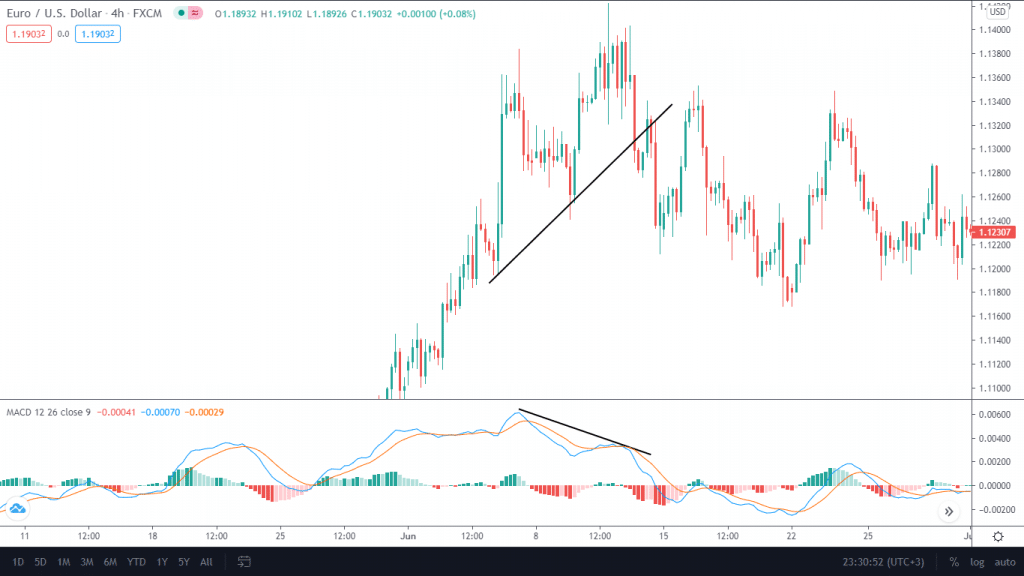
Image 4: As the price creates higher highs and lows, the indicator is doing the opposite. The consequence is seen in the form of a short-term reversal.
MACD strategies
Top investors have already worked out the best possible strategies with maximum probability. Do not try and tweak them as they are already tested frequently.
- Price action. Technical traders who use price action patterns in trading can use MACD in confluence with their trend lines, Fibs, key levels, and support and resistance.
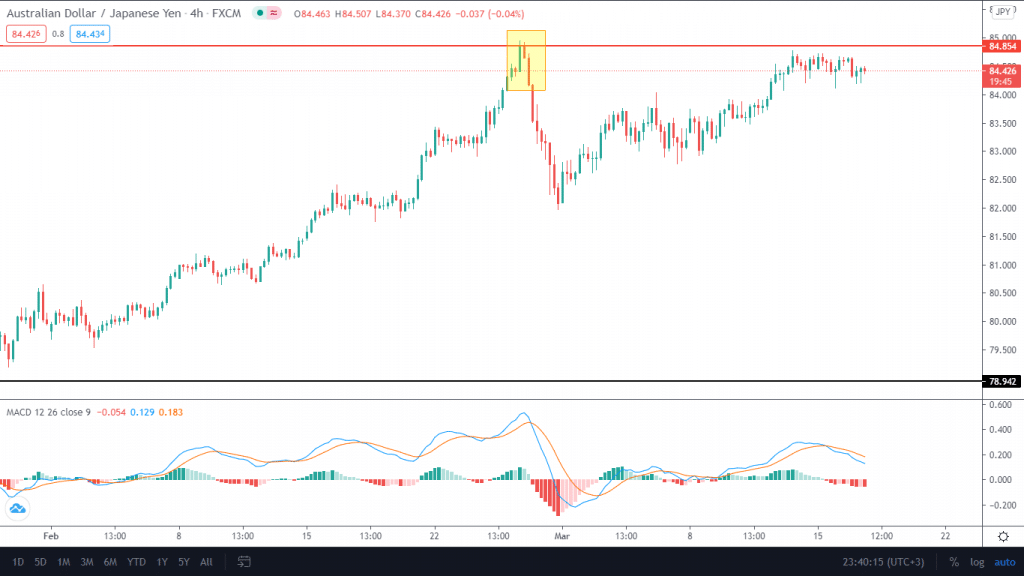
Image 5: A price action trader spots an opportunity for a short trade as the moving averages cross over in the MACD, and a bearing engulfing pattern shows up at the daily resistance on AUD/JPY.
- MACD and moving averages. For this strategy, you can wait for the price to cross 50 and 100 SMA and simultaneously let the crossover happen at the MAXD. Use it on the daily or 4-hour charts by placing your stops beneath the MAs.
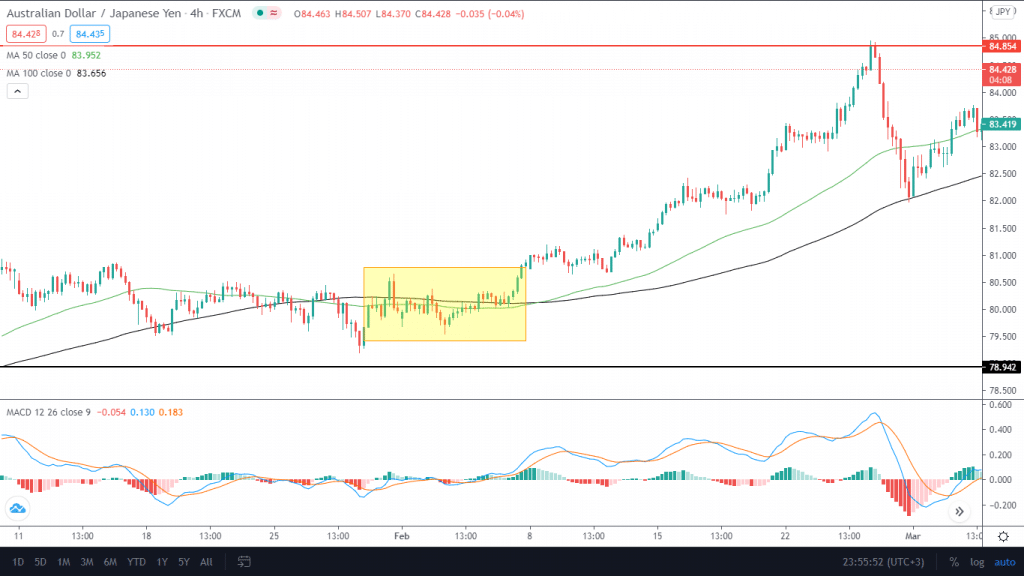
Image 6: As the price crosses the 50 and 100 SMA, traders enter the long trade couple by the cross over in MACD. Remember that the price has to move significantly in one direction by a margin of several pips, indicating a clear buy or sell.
- MACD and RSI. This strategy is relatively simple to understand and imply. Use the overbought and oversold conditions from the RSI in combination with the cross-overs from MACD.
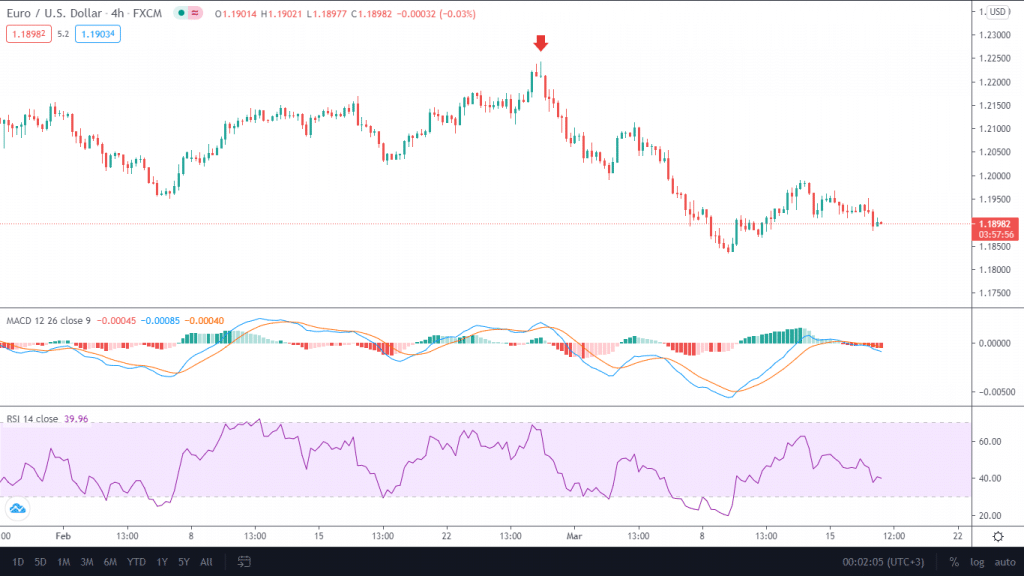
Image 7. The red arrow indicates a potential short execution that satisfies our setup. You can see the RSI in oversold condition and the moving averages in MACD crossing over.
End of the line
MACD does offer easy and straightforward strategies for traders. However, keep in mind that you have to note your risk management and psychology for an indicator to be profitable. If you start interfering in trades out of your whim, the result will be quite dissatisfactory. Also, it is essential to keep in mind that MACD is a lagging indicator. The famous cross-over may take some time to develop.
