Indicators are technical tools that help determine entry/exit points, trading setups, market volatility, volume, and many more. Over time many different market indicators have contributed to technical analysis to increase the winning probability of executions. There are two types of this tool:
- Leading indicators that predict the future movements of the price.
- Lagging indicators that use the past information to build themselves up. They may also predict long-term future price movements.
Benefits and demerits of indicators
It is essential to know about the potential benefits the indicators have for traders before we employ them in our charts:
- Probability. As stated before, indicators help introduce a winning outcome of your trades.
- Mindset. Indicators work like robots; therefore, they don’t have any emotions. These tools are not disturbed by losses.
- Consistent. These tools work on the set of coded inputs, therefore, perform with the same consistency.
- Decisions. They can compliment you in your trading strategy and help you make decisions.
Whereas the demerits are:
- Scammers. There are tons of indicators in the market, out of which only a few perform up to their name. Some are sold by scammers for up to $1,000 to newbies as the get-rich-quick scheme quickly attracts them.
- Lagging. Lagging indicators are sometimes rendered as useless as they show you the history instead of the future.
What is Ichimoku Cloud?
Ichimoku Cloud was developed in the 1930s by a Japanese journalist Goichi Hosoda, who spent nearly 30 years refining the indicator before releasing it in public. It is also known as Ichimoku Kinko Hyo, which translated to an instant look at the balance chart. Taking the first peek at the price action tool may feel like it is hard to grasp all the stuff going on, but it is pretty straightforward to use.
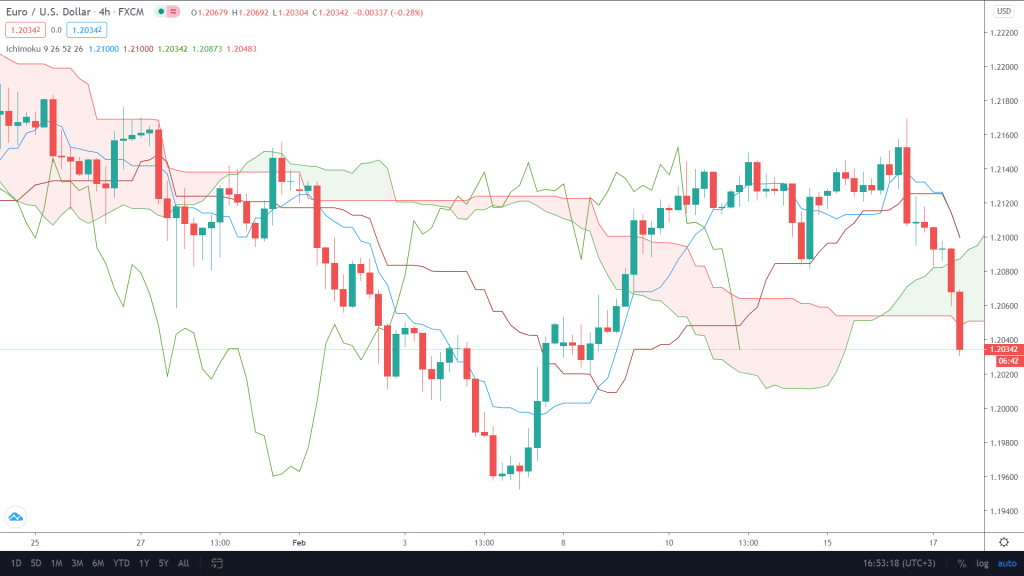
Image 1. You can see the Ichimoku cloud on a Tradingview chart.
We will discuss these lines and the Cloud while discussing using them and related strategies for our understanding. The indicator is considered one of the best in the industry for gauging momentum, identifying support and resistance, and trading signals. Overall the tool mixes up with the price action traders and others as well.
Using Ichimoku Cloud
Ichimoku Cloud is helpful for the following purposes in trading.
Support and resistance
Traders use the highlighted area of red and green as a potential support and resistance point depending on where the price is.
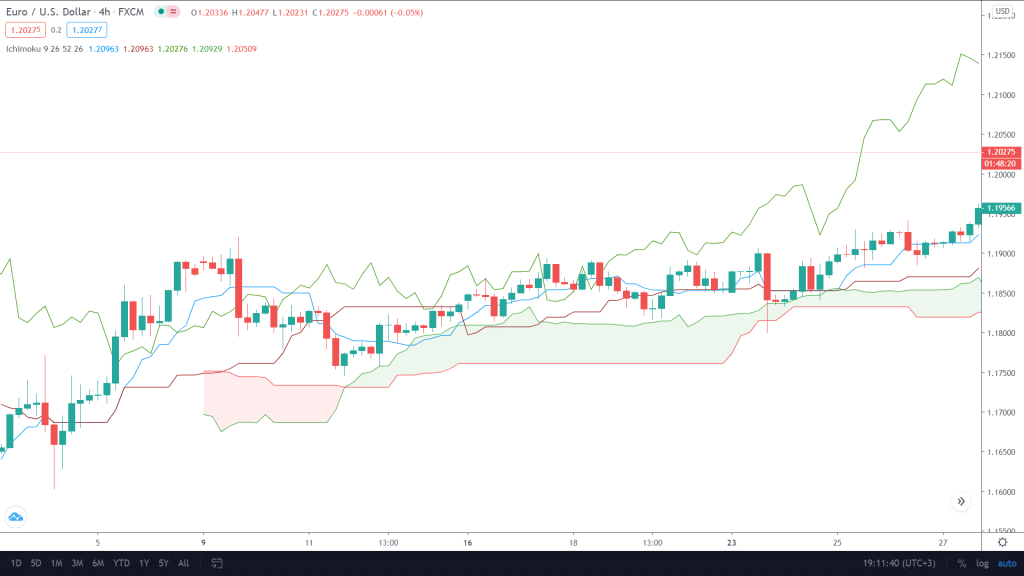
Image 2. Notice how the Cloud is acting as a support to keep the price up.
Trend
If the Cloud is green or, in technical terms, if the leading span 1 is over the 2, it indicates an uptrend. The area between the two lines will be marked as green in this case and vice versa for a downtrend.
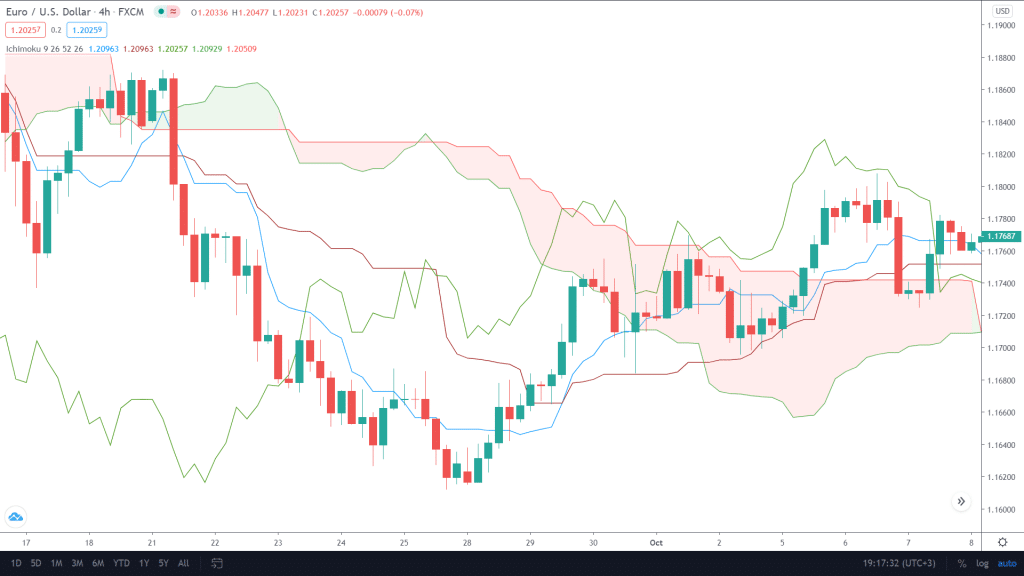
Image 3: A red cloud shows that the asset is in a downtrend, and bears are currently in control.
Based on the color, you can also take similar buy or sell trades without waiting for other confluences.
Momentum
When the conversion or the blue line alongside market price is above the base or red line, bullish moment signals are available. The opposite can be said about bearish signals.
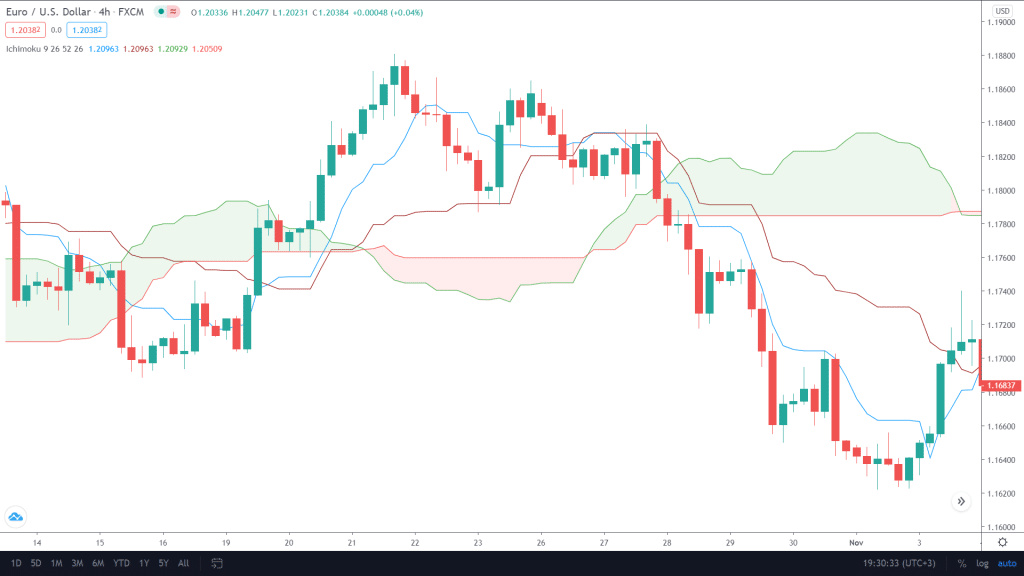
Image 4. To make it easier, we removed the lagging span, aka the green line. Notice how the blue line above the red shows a positive momentum compared to when it is below.
Ichimoku Cloud strategies
You can mix up various indicators and chart patterns to go along with the Cloud. The testing will take some time, of course. There are also pre-built strategies with proven outcomes that can be followed for the best results.
- Price action. Ichimoku cloud is one of the favorites among technical traders who use price action. Market participants use it on charts alongside other support, resistance and key levels, supply and demand zones, trend lines, and chart patterns. The complete combination has a fruitful outcome with a high chance of winning trades.
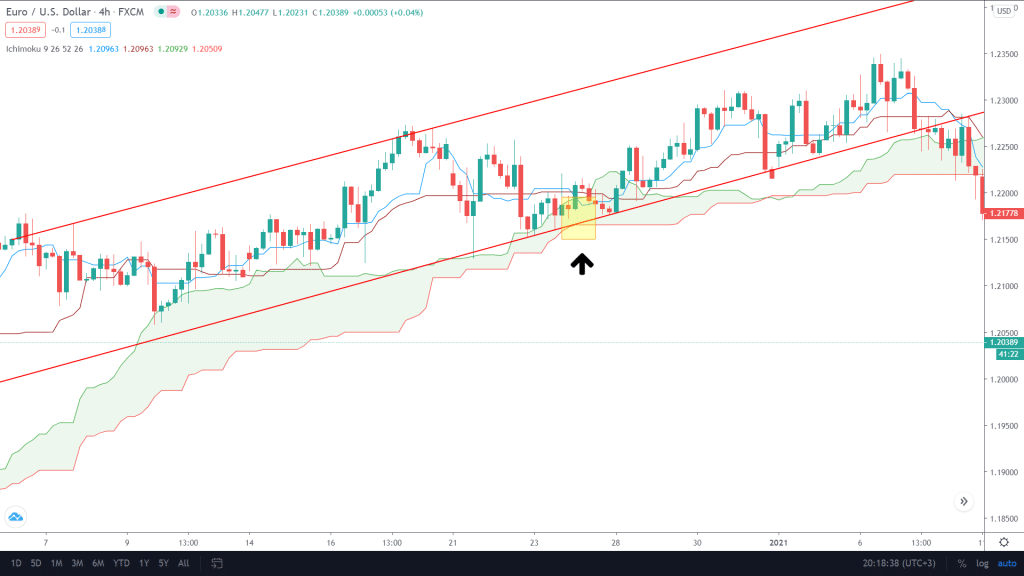
Image 5. Trend lines show the momentum in an upward direction, which Ichimoku confirms.
- Ichimoku and RSI. This is an advanced strategy that uses the divergence in Relative Strength Index to identify tops and bottoms and confirm entry through Ichimoku cross-over. You can place the stop loss more closely as this plan provides super accurate signals.
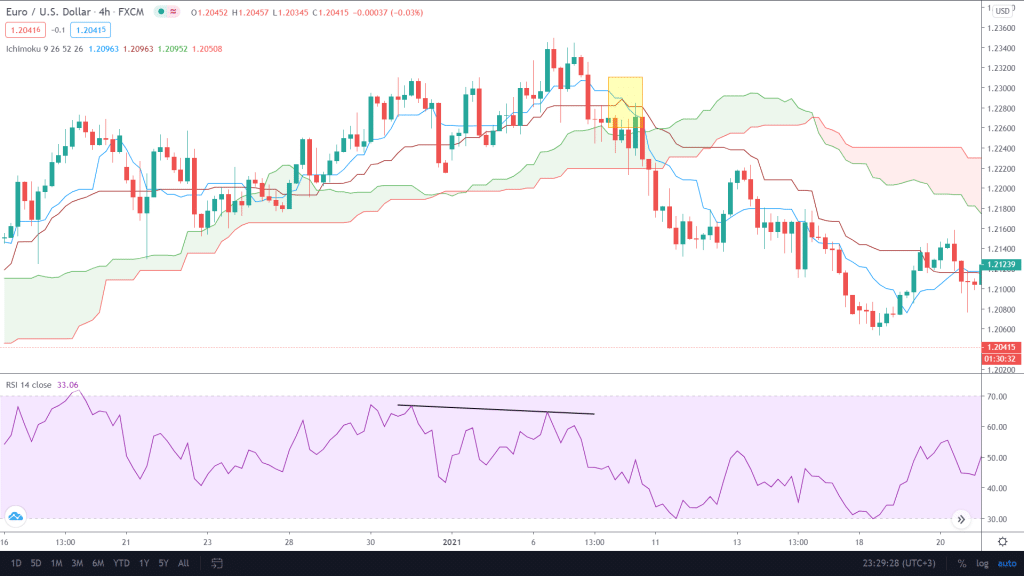
Image 6: The black line over the RSI indicator shows divergence, and the yellow highlights the cross over at Ichimoku. A perfect risk-reward ratio is at hand.
- Ichimoku and moving average. This strategy is better suited for long-term investors. It is quite simple to follow as you employ the 200 or 250-period simple moving average (close) to indicate if you’d like to short or go long. If an asset is below the MA and there is a crossover in the Cloud, it’s time to sell and vice versa.
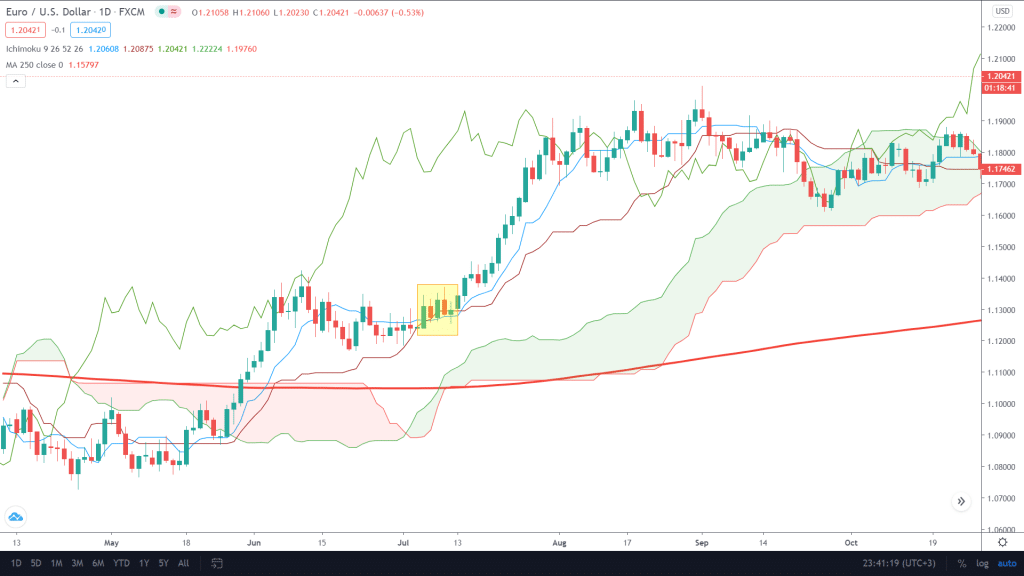
Image 7: On the daily chart in EUR/USD, we see a buy setup as the price is above the 250 period MA. The cross-over also provides confluence alongside the formation of bullish candles. You can place the stop loss beneath the bars as there are fewer fluctuations on higher time frames.
End of the line
Scalpers, day, and swing traders can use the strategies available by the use of Ichimoku Cloud. In the beginning, traders may get confused with it but remember it holds good profits if understood well. The better way to utilize Ichimoku is to use it in combination with other indicators to get the best hand in markets.
