While there are many traders using technical indicators, not all of them possess sound knowledge about the strategies that are formulated using these. If you don’t spend time looking into the working principles of the indicators, you may end up placing the wrong trades. Let us take a look at the Stochastic indicator and how it should be used.
What is the Stochastic indicator?

The Stochastic indicator gives you a reliable indication of the market momentum. It determines whether an asset’s price is oversold or overbought with respect to price shift for a fixed period of time. While other indicators follow the volume or price, this one follows the market momentum.
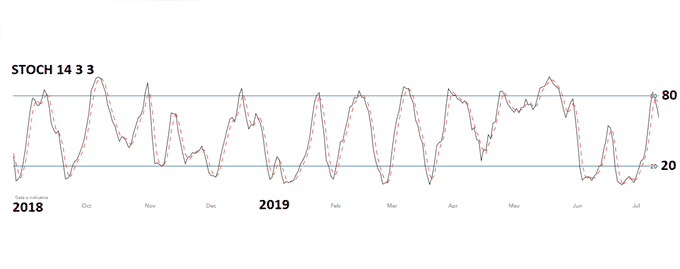
The indicator consists of two dynamic lines oscillating between two fixed horizontal lines. When these lines cross the upper horizontal line and move upwards, the price is said to be overbought. Conversely, when they intersect the lower horizontal line and move downwards, it is said to be oversold.
Generally, the period setting for the Stochastic indicator is taken as 14. This oscillator compares the ending price to the absolute peak and absolute trough of that specific time period.
How to calculate it?
The two lines associated with the stochastic indicator are known as signal line (%D) and indicator line (%K). If you wish to find the value of the %K line, you need to deduce the period’s lowest price from the last closing price. The result is divided by the difference between the period’s highest and lowest prices.

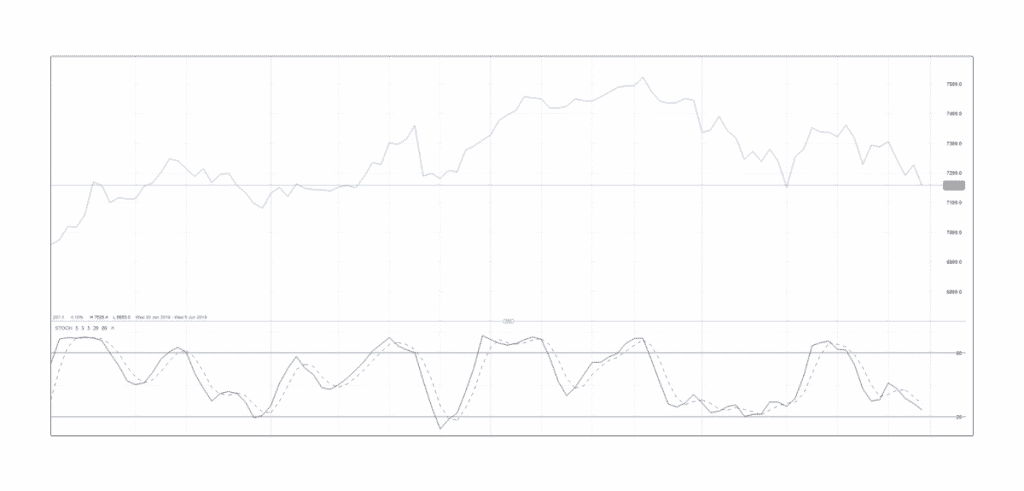
The formula for the %K line is as given above. The %D line is a 3-day simple moving average of the indicator line.
Identifying buy and sell signals
For the Stochastic indicator to be useful, you must interpret the readings correctly. This is a bound indicator operating on a 0-100 scale representing an instrument’s full trading range during the trading period. The final percentage depicts the area where the latest closing price is located in the range.
Thus, you can easily point out oversold and overbought regions. No matter how much the market volume and price suffer from fluctuations, the indicator always remains within this range. As a general rule, readings above 80 indicate an overbought condition, while those under 20 indicate an oversold market.

Take a look at the above chart, where the indicator line is represented by the black line, and the signal line is represented by the dotted line. As soon as these lines intersect, you should take it as an indicator of a market shift. If the indicator line crosses above the signal line, it is considered a buying occasion, provided they are not more than 80.
On the other hand, when the indicator line crosses below the signal line, it is a short trade signal, unless they are both under 20. When the Stochastic indicator shows a higher low, but the price demonstrates a lower low, it is a sign of an uptrending divergence. The downward momentum is, therefore, quite low, and the market might see a downward reversal.
Conversely, once the price shows a higher high along with the indicator forming a lower high, it’s an indication that the upward momentum is decreasing. This is usually followed by a bearish reversal in the market.
Overbought and oversold levels

There is a mistake many traders make while identifying oversold and overbought levels using the Stochastic indicator. They think an overbought market is likely to go up and an oversold market is likely to fall, but this is a wrong concept.
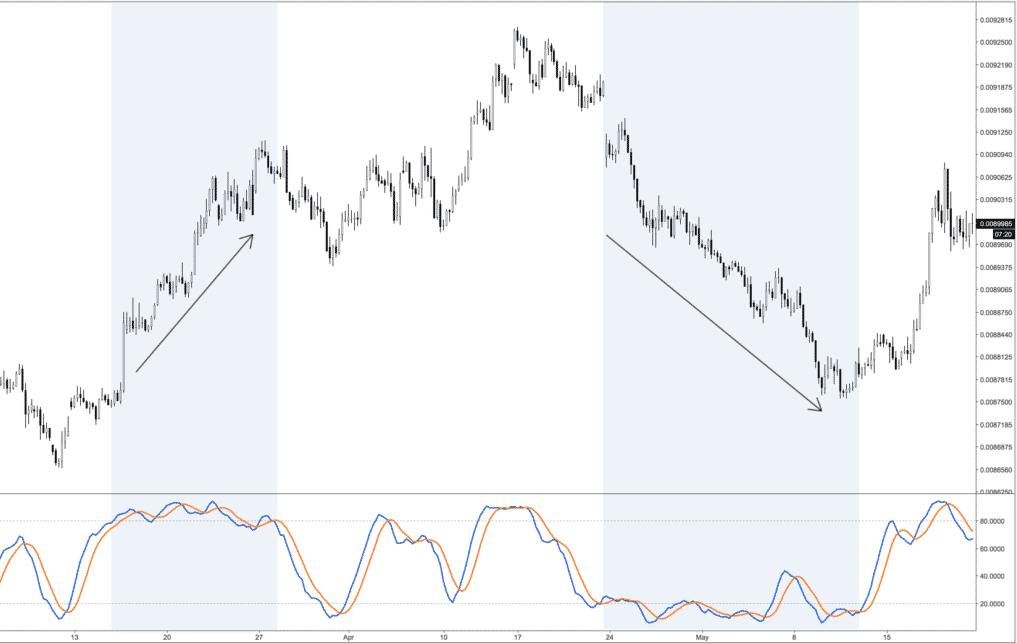
When the value of the Stochastic is more than 80, it indicates a strong trend, but it is not necessary that the prices will reverse from here onwards. When the indicator value is high, it tells you that the price is capable of closing near the peak, and it rises further upwards. In a scenario where the Stochastic is more than 80 for an extended period of time, the momentum is said to be high, and it is not the perfect opportunity to sell your assets.
In the above chart, you can see examples of bullish and bearish trends. As you can see, the indicator remained above 80 and below 20 for long periods of time. So it would be a mistake to treat these as overbought and oversold regions since the trends are quite persistent.
Stochastic vs. RSI
RSI or Relative Strength Index is a popular technical indicator used by many traders. Let us take a look at how it is different from the Stochastic oscillator.
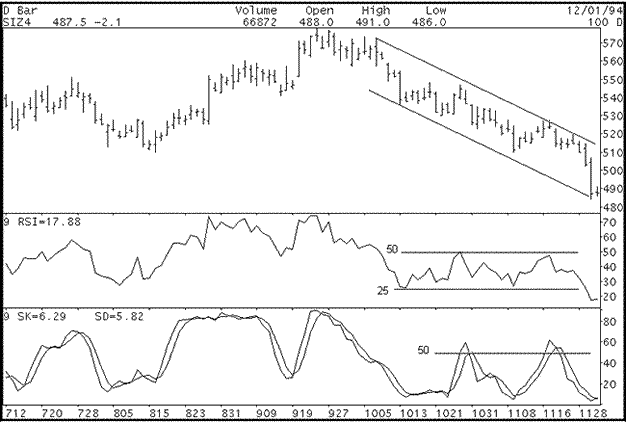
The RSI indicator is a better option if you are dealing with a trending market. Stochastics, on the other hand, is well-suited for sideways moving markets. The purposes of these indicators are quite different.
Using the RSI indicator, you get an idea of when the asset’s price has shifted too much in a short span of time, thus signaling a trending market. The Stochastic indicator allows you to discover when the price has shifted to the peak or trough of the range, thus implying a flat market.

Consider the chart above where the RSI oscillated between 40 and 25 for a greater part of the declining period in the fourth quarter. The Stochastic indicator, on the other hand, shifted from an uptrending 60 to 5 (oversold). This indication of market reversal is not true, and so it is evident that RSI is the better indicator to use in a trending market.
Final word
If by studying the price candles, you can make an idea about momentum, you don’t really require the Stochastic oscillator, but it is still a decent tool to have at your disposal. It is especially useful for identifying upward and downward divergences. However, you must employ your best judgment while using this indicator for live trading.


