Relative strength index is a tool used for technical analysis of the market to improve your decision making and accrue more profit. Read on to find out how.
What is the Relative Strength Index (RSI)?
Developed by J. Wilder, the relative strength index is a technical indicator that is used to identify odd trend behaviors in asset price charts. It is primarily used to spot trend reversals and measure a trend strength during a particular point in time.
Some of the features of RSI are:
- Momentum oscillator. A momentum oscillator is an indicator that observes and records even minute fluctuations in the pricing mechanism of various securities. It moves between extreme values of high and low to capture any price changes.
- Lead indicator. Lead indicators predict future movements of the price for various securities based on current or historical figures.
Traders also use the RSI to check for overbought or oversold securities. A security is said to be oversold when it functions at a price below its reasonable price. Such securities are undervalued in the market. A security is said to be overbought when it functions at a price above or higher than its reasonable price. Such securities are overvalued in the market. Overbought or oversold securities are generally followed by trend reversals to achieve their market equilibrium prices. Investors need to know as and when securities are overbought or oversold. This decides whether the upcoming reversal will lead to an uptrend or a downtrend.
By observing various trend patterns using the relative strength index, traders can form better trading strategies and plan their investments effectively. Trends in a price chart have been known to repeat themselves over time, which is why it is crucial for traders to be aware of different trend patterns that occur. Using the RSI, you can forecast future price behavior with greater precision. The index makes it convenient to distinguish strong trend signals from weak signals. You can also use the RSI to compare the different trading options available at your disposal.
How Do You Calculate the Relative Strength Index (RSI)?
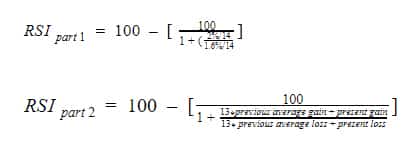
The Relative Strength Index is measured within a range of 0 to 100. It is taken as a line that moves between the two extreme values of high and low when the price fluctuates for an asset. The formula to calculate the relative strength index is as follows:

The RSI is generally measured for a 14-period average. Traders can customize the time period for their objectives. Follow the steps given below to calculate the RSI:
- Note the price changes for a 14 day period. Check whether the prices ended in gain or loss. Let’s say that the closing prices were higher than the opening prices on 7 out of 14 days and lower on the other seven days. Assume that the average gain for those days was 2%, and the average loss was 1.6%.
- Now, enter the values in the formula below.


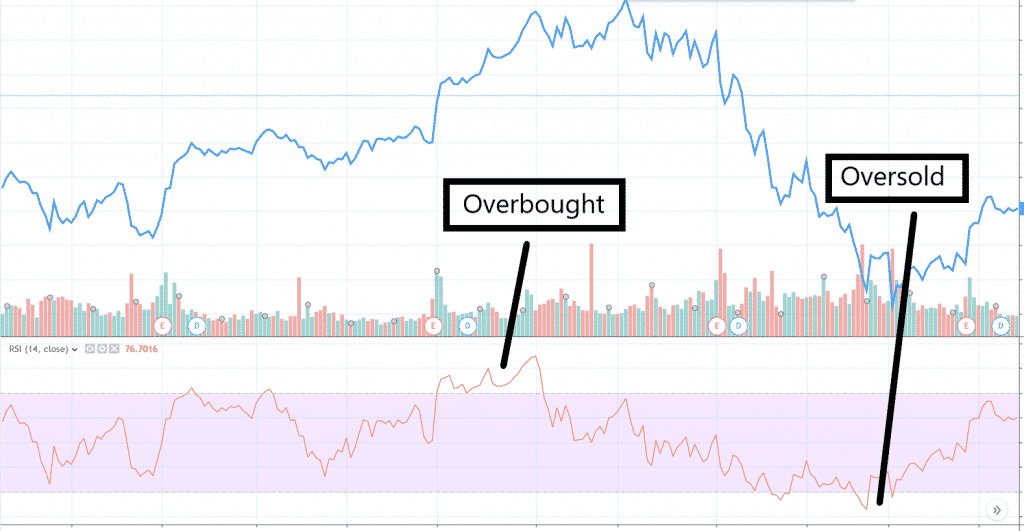
Here, the RSI is formed below a regular price chart for an asset. Two lines are set to denote the high and low bar for the RSI. When the prices move above the RSI lines, it registers them as overbought or oversold.
Understanding RSI: Spotting Trends, Reversals, and Divergences
- Setting-up Parameters in RSI.
Generally, an asset with an RSI value of 70 or more is considered to be overbought (overvalued), and an asset with an RSI value of 30 or less is considered to be oversold (undervalued). During lasting trends, securities tend to remain overbought or oversold for longer times; traders need to readjust the values of the RSI according to the market conditions. For example, in a lasting uptrend, traders tend to set the overbought level at 80. The RSI registers trends at values between the 40-60 marker also although they are generally weaker trends.
- Midline Crosses using the RSI.
A midline cross occurs when the RSI goes above or below 50. The midline is also an indicator of the start of a trend. RSI above 50 indicates an uptrend, and below 50 indicates a downtrend. It is advised to use RSI with moving averages to confirm trends. Traders can use 50 as a mark for setting support and resistance levels in a midline cross strategy.
- RSI Divergence.
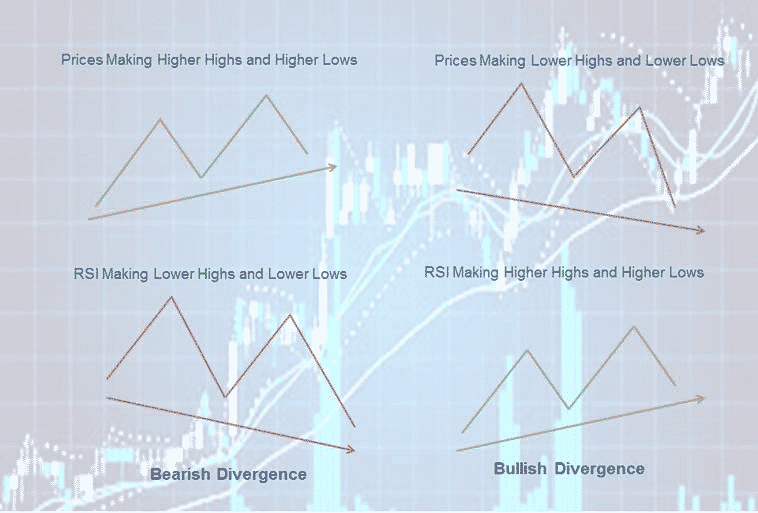
Divergence occurs when the indicator moves against the direction of the trend. If the price is rising and the indicator is showing a fall in the index, it is the sign of a bearish divergence. If the price is falling and the indicator’s value is rising, it is the sign of a bullish divergence.

It is a popular trading strategy for traders to enter at low and exit at high RSI. Professionals advise traders to enter the market when the RSI is at around 30 and exit it when it is around 70.
Bottom Line
The Relative Strength Index is a versatile momentum oscillator. In spite of changes in the market and volatility over the years, its relevance has stood the test of time. It is important to note that although the relative strength index and the money flow index work similarly to each other, they give different results. The RSI takes price as a variable into account, MFI also uses volume as an indicator. Always rely on a combination of indicators, technical and fundamental, to assess the market situation. Using technical indicators only works efficiently with proper risk management and portfolio diversification. It is in your best interest to evaluate risks and invest only according to your risk appetite.


