
Forex indicators are a useful tool to help out a trader make his/her trading decisions and provide signals. Over time, various indicators have been developed through the hard work of several years. While they may not promise a full 100% winning rate, they sure do provide you an edge in the charts.
Technical traders use these tools frequently and mix them up with each other. While one indicator shows a potential reversal, the other provides additional confirmation depicting overbought conditions—the confluence results in high probability setups.
Benefits and demerits of indicators
Indicators have the following benefits for traders:
- Signals. They provide useful signals that one can interpret by looking at the cross-overs or the related ups and downs. Some indicators are fully automatic that tell you when to buy or sell an asset exactly.
- Winning rate. They increase the overall winning rate of your portfolio by guiding in technical areas.
- Management. Some indicators help you determine the lot size and risk percentage, therefore, help in managing executions.
- Prices. Indicators help give an insight into what the future of an asset will be. They confirm potential trends.
Whereas the demerits are:
- Selection. As there are tons of indicators, choosing the right one may be tricky, especially for beginners. They spend most of their time in initial trading to find the whole grail tool to make them rich.
- Lagging. Lagging indicators are not useful at all as they don’t predict future prices.
What is Fibonacci retracement?
Technical trading did not begin until early 1800; however, its tools date back up to 1300. Fibonacci retracement is based upon key numbers identified by the famous mathematician Leonardo Fibonacci in 1300. On any chart, you can draw out this indicator by using a peak and a bottom where the total distance will split up into Fibonacci ratios as 23.6%, 38.2%, 50%, 61.8%, and 100%. Traders use levels above 100% and below 0% as a stop loss and take profit targets.
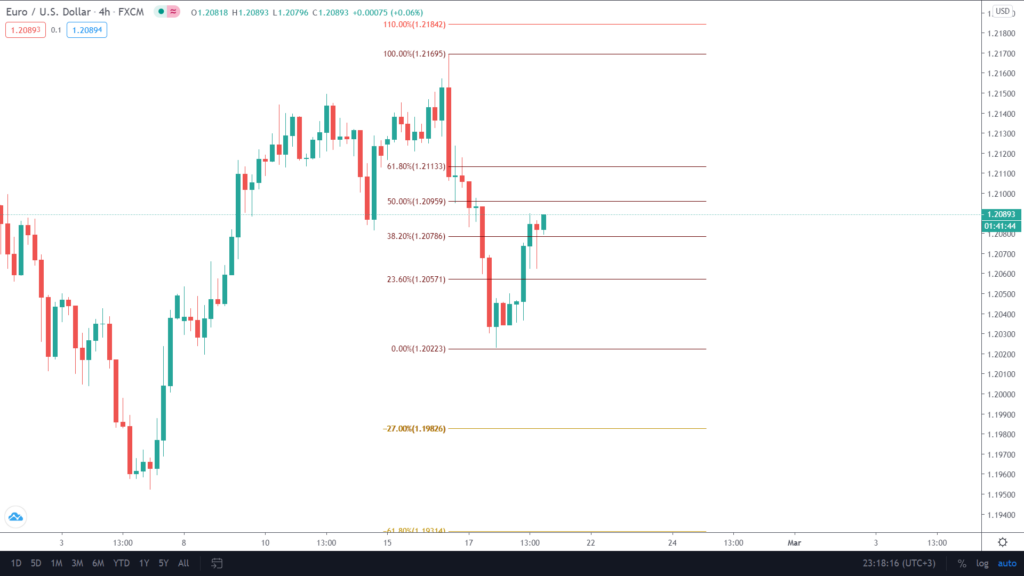
Image 1. You can see the Fibonacci retracements on a TradingView chart. There are levels above 100% and below 0%, which we will explain later.
Fibonacci is one of the primary choices of price action traders. It blends in with other indicators and shows reversal areas, support, and resistance, stop loss and take profit placement points.
Using Fibonacci retracements
You can use Fibonacci retracements for the following purposes in your trading.
Support and resistance
When the price retraces, indecision is at each percentage level, which acts as support or resistance. This is where the traders’ lookout for the asset to fall back for the trend continuation.
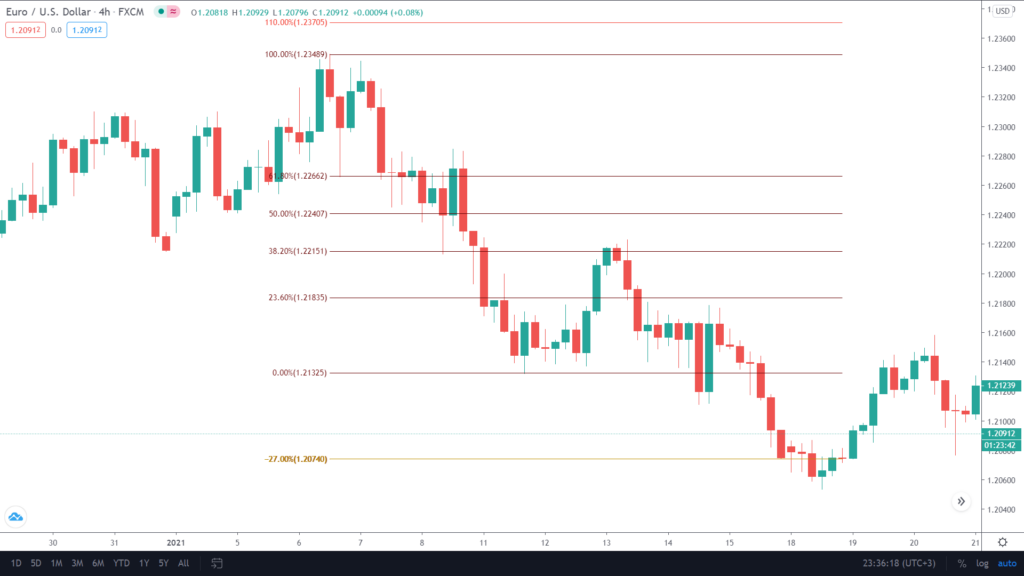
Image 2. The price retraces itself to one of the famous points, i.e., 38.2%—traders especially lookout for this and 61.8% for resistance.
Momentum
The higher the price retraces, the slower the next move in the trend direction will be. These types of retracements also result in the formation of chart patterns such as double tops and double bottoms, to name a few.
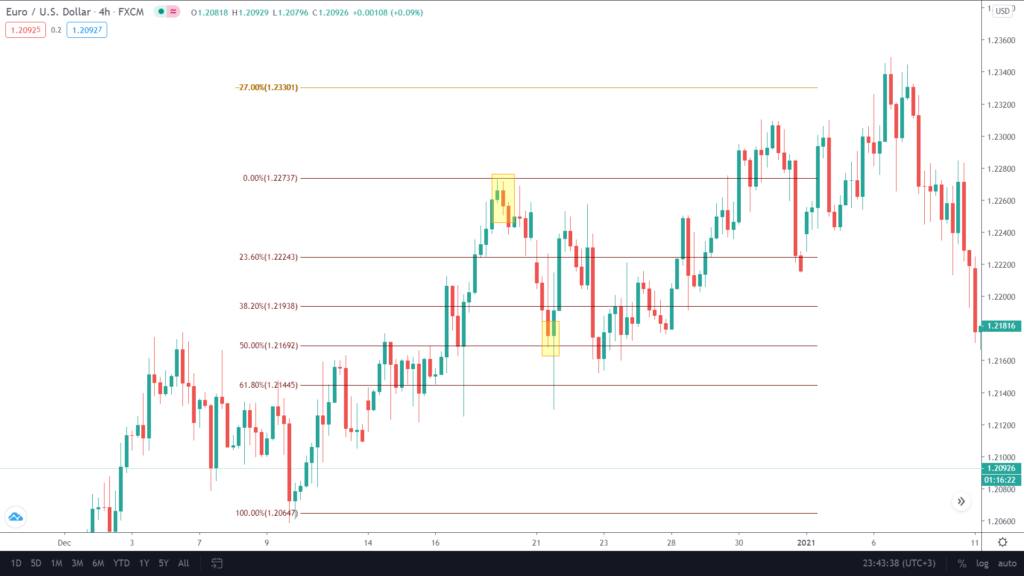
Image 3: The price retraces itself to a 50% mark and bounces back to -27%. The pullback would have been substantial if the initial retracement was near 23.6 or 38.2%.
Some traders do not hold 50% retracement as a point for continuation. They argue that the market can still go both ways if it is stuck in this area.
Take profit and stop loss
Use Fib levels as TP and SL targets. 110% and 120% are available as stop-loss points, while -27% and -61.8% are your profit targets.
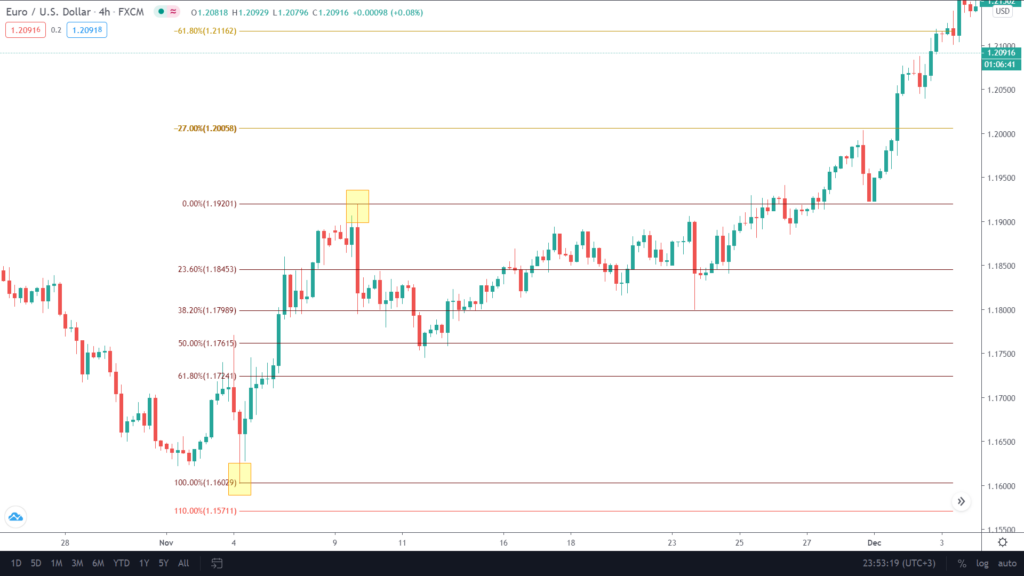
Image 4. A trader places their stop loss for a buy trade at 110% and aims at -61.8% for his target, which is comfortably achieved.
Fibonacci retracement strategies
Trying out Fibs with other indicators and working on finding the best possible outcome can take a lot of time and losses. We have included the top strategies verified and tested by professionals and institutional-grade traders to save you from the hassle.
Price action
As mentioned before, Fibonacci is the favorite choice of price action traders who utilize it with key levels, trends, supply and demand zones, and trend lines.
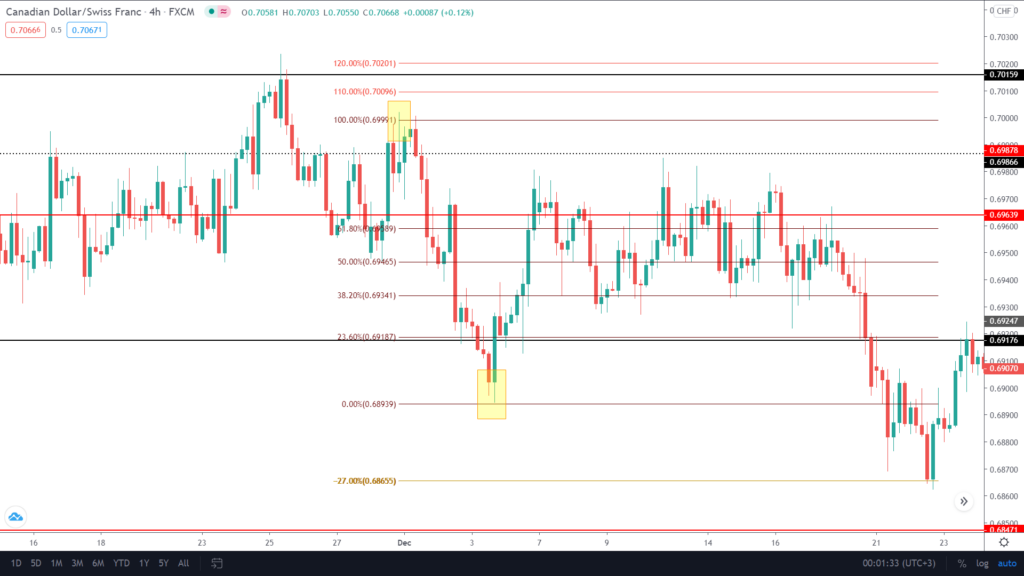
Image 5. The red line is the daily key level where the price retraces up to 61.8%. The trader places a short trade at the instance targeting -27%.
Fibonacci and RSI
The strategy is simple, as you point out reversals in trend using divergence from RSI and retracement levels from Fibs.

Image 6: The black line in the RSI indicator shows divergence coupled with a -27% retracement on the Fib provides confluence for a potential reversal in the uptrend, which shifts over to a downtrend.
Fibonacci retracements and moving averages. It is possible to combine Fibs and MAs of different values. You can use the 200-period exponential moving average as a support and resistance or choose to utilize 8 and 20 simple moving average crossovers for reversals. Use any time frames you like.

Image 7: Let us use the same chart as above with the MA added and the RSI removed. As soon as the 8 SMA crosses 20 SMA, a trader jumps in on a short but looks at the Fibs for additional confirmation. It is also possible to use RSI, Fibonacci, and moving averages altogether.
End of the line
The Fibonacci indicator is one of the simplest in the markets. It is the primary choice for beginners who believe technical analysis is their go-through plan. Do not mix it up with too many indicators, as it will further complicate your trading. There are drawbacks associated with every market tool so make sure to study them as well.


