Technical indicators are analysis tools that help you determine various vital elements such as volatility, trade opportunities, momentum, price averages, and many more, to name a few—novices who enter the industry search for whole grail stuff that works with 100% accuracy. In the markets where nothing is fully guaranteed, the indicators only mean to aid you in making decisions. The first ones were developed for stocks and daily charts as back in the days before the era of the Internet 24 hour time frames were the standard.
Advantages and disadvantages of the indicator
While there are tons of indicators with individual pros and cons, we can associate a few general to all. The benefits are as follows:
- Time frames. You can apply them to most charts and time frames, depending on their coding.
- Analysis. They are the first choice of technical and fundamental traders.
- Variety. A vast collection of indicators are available, both free and paid to choose. Unlike most tools that ask a considerable amount of money, these technical tools are free in most cases.
- Easy. Even a pure beginner can use these indicators and place trades without any significant knowledge of financial markets.
- Emotions. The indicators are free of any feelings and depict results based on input.
The demerits are:
- Performance. The lagging indicators guarantee no future performance.
- Risk management. There are no pointers on where to put your stop loss or take profit for indicators that point out potential trades. It can be confusing to set proper risk management.
What are Bollinger Bands?
Named after its creator John Bollinger these bands were created initially to work on the stocks. They have a moving average in the center and two bands, one on the top and the other on the bottom, adjusting according to market volatility. It employs a percentage calculation method for adding and subtracting the standard deviation formula used to measure movements.
Depending on the severity of ups and downs in prices, Bollinger bands contract and expand.
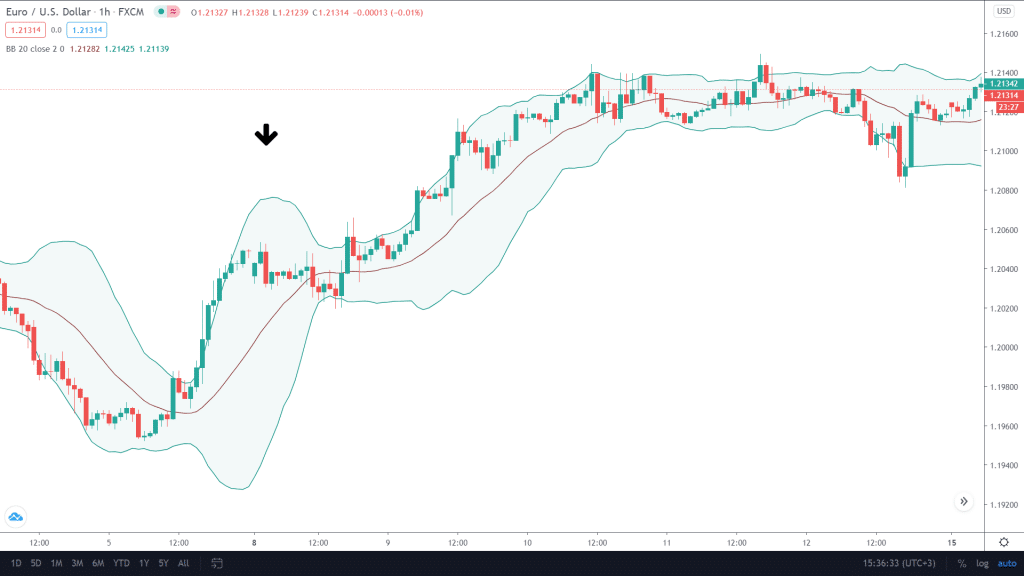
Image 1. The area marked by the black arrow shows a period of high volatility, and therefore, the bands have expanded.
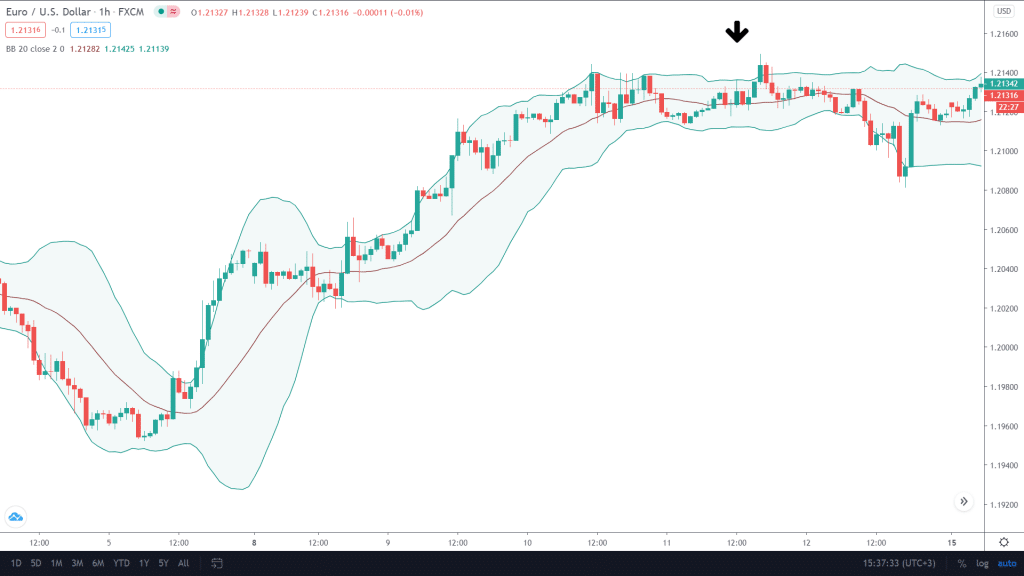
Image 2. The area marked by the black arrow shows a period of low volatility, and therefore, the bands have contracted.
Using Bollinger Bands
There are various ways in which you can utilize Bands in your trades.
Support and resistance
To put it simply, the 20 period moving average has always been a good setting point as a support and resistance, and you can include the bands in this list. When the price deflects off the lower band, the MA is the next point for the bears’ to keep it down and vice versa.
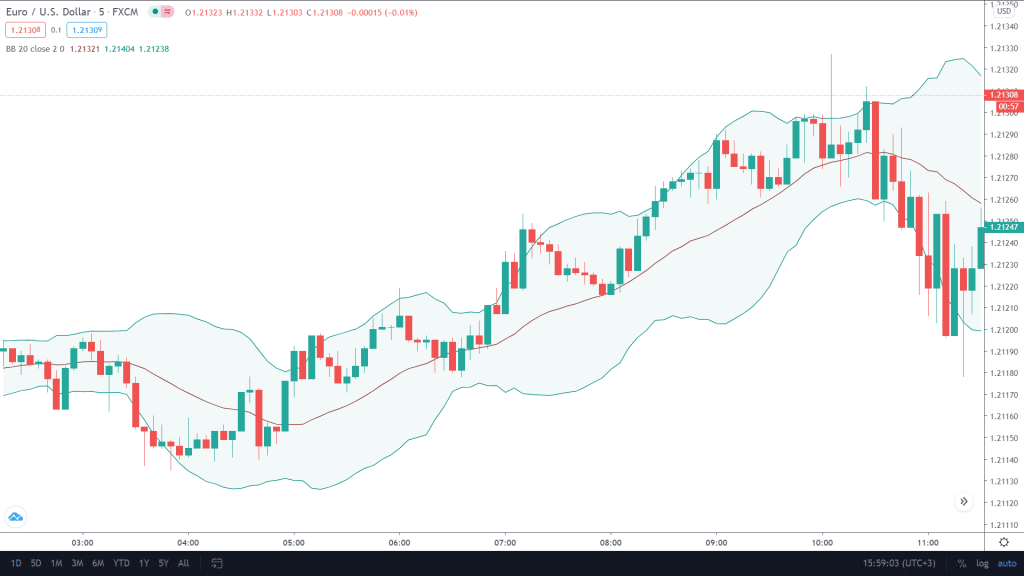
Image 3. The 20 MA acts as a support and holds the instrument in an uptrend.
Price targets
Any trader who uses price action can use the upper and lower band for potential take profits or stop loss. Both lines can hold the instrument or continue to trend further but eventually reverse or straighten up.
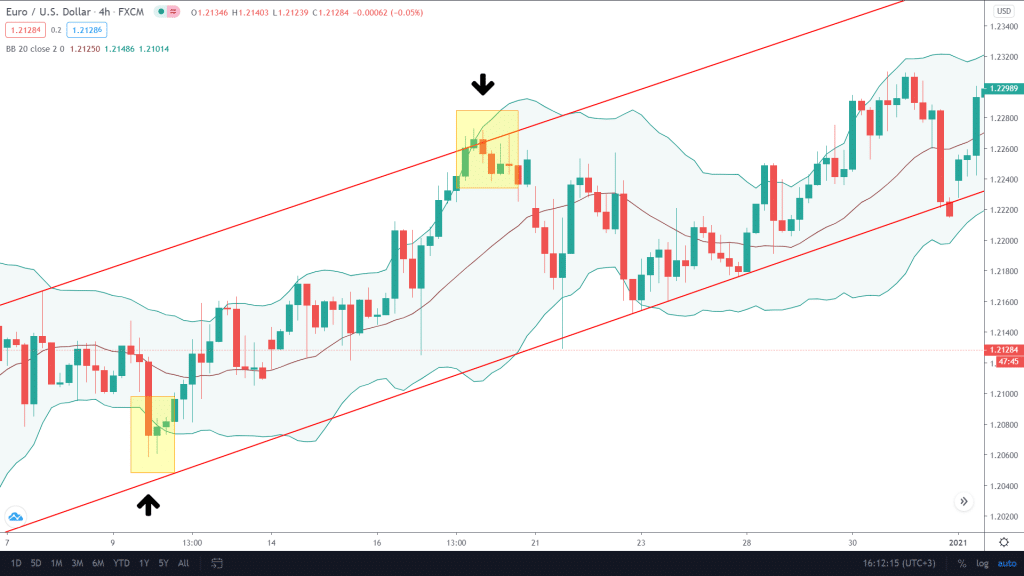
Image 4: A trader who decides to go long at an uptrend gets out at the top when the price touches the upper band.
Trend indicator
An uptrend is defined by the Bollinger bands when the price is between the upper and middle lines. The approach is similar for a downtrend, with the asset fluctuating in between the moving average and bottom band. It is a common analogy that when the candles are touching the top line, the price will break up and vice versa. Also, keep in mind that markets only trend about 20%, so the chances for this to work might be slight.
Bollinger Band strategies
Many different strategies associate themselves with these bands’ use to increase trades’ probability significantly. Don’t spend your time configuring the standard deviation or the moving average as professionals already pretest those.
- Double bottom/top. Most of the traders are familiar with the famous pattern double top. Using it in confluence with the Bands is easy as you can put a long or a short as soon as the next endpoint of W or M coincides with Bollinger’s line.
- Riding the trend. A common mistake that most market participants make in their early stages is putting buy and sell positions as the candles touch the upper or lower one of the Bands. Coupling the break with other indicators such as volume is the correct way to predict and ride a trend.
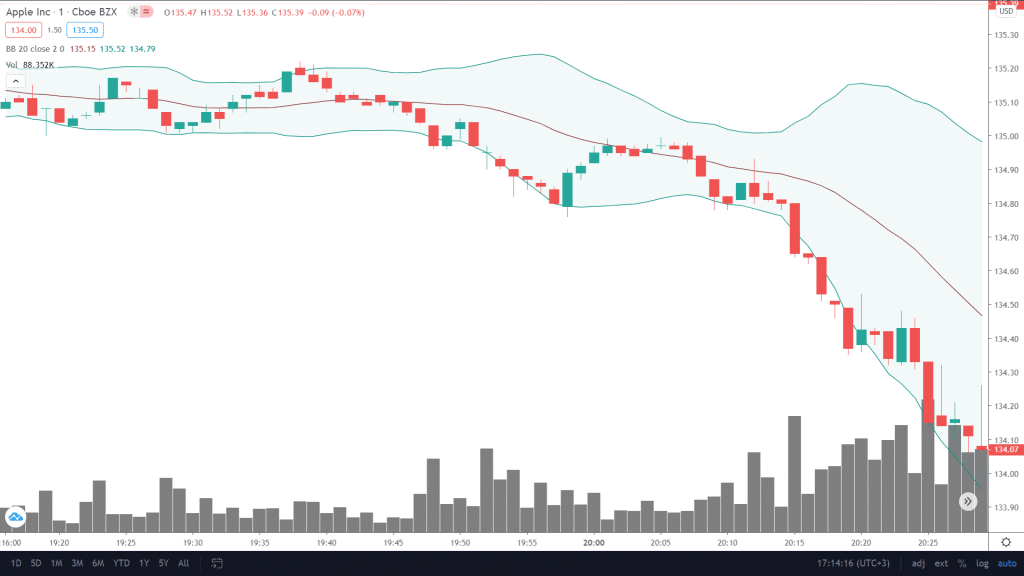
Image 5: Major volume accompanied by a bearish candle at the lower line.
- Between the bands. Only use this strategy in periods of low volatility. In stocks during lunch hours and currencies during the Asian session. Take respective buy or sell trades as the candles touch the upper and lower part.
- Squeeze. As stated before, the squeeze of the band indicates that the volatility has died. This alone should not be taken as a trade setup; however, it allows you to understand that there will be a move sooner. The longer the candles are between the Bands, the higher the upcoming trend will be.
End of the line
Bollinger Bands do offer relatively easy and unique strategies for traders of all experience levels. Using this indicator with a good set of risk management and mindset will ensure that you profit from it. Never use the Bands alone, and do not mix it up with Keltner Channels. They are similar in some sense but are not alike.
