
Last week was signified by the US dollar recovery as the DXY finally got a hold above 91.00, exceeding the high of 91.5, which the index formed, attempting to resolve the H&S pattern for the first time.
The market has approached the 92.00 support-turned-resistance. Without any signs of stalling, the market broke through the level, giving us more evidence of a reasonable correction in the dollar or even a possible reversal. The next milestone in establishing a confirmed uptrend would be getting above the 200-day Moving Average, which currently hangs around 93.00.

As long as DXY stays above 92.00, it makes sense to consider a bullish stance on USD, thus expecting a correction in risk assets.
Traders still need to be cautious about taking longs in USD. The “smart money” tells us that the underlying demand for risk assets doesn’t stall. Look how 10-year yields recovered, reaching 1.6% after a sharp pullback to 1.4%.
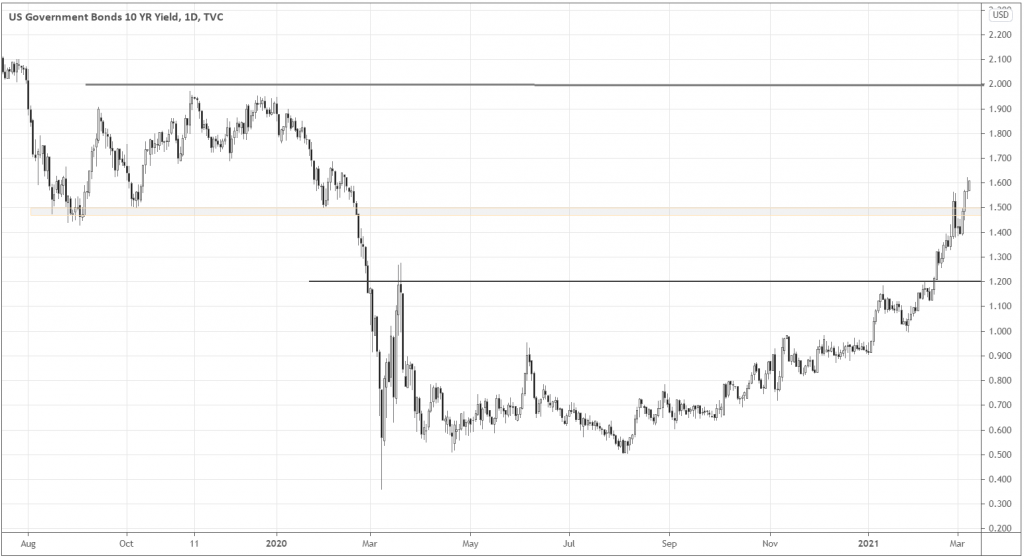
As yields keep holding above pre-pandemic levels, there is much room for higher rates, as there is no significant resistance until almost 2%. Such an uptrend in yields is likely to put pressure on USD, so stay vigilant.
For those who still are fond of safe-havens – try USD/JPY
Suppose the idea of buying USD thrills you, a “safe” bet among current risk-seeking sentiments would be considering going long against another self-haven. USD/JPY has been ripening – the long-term symmetrical triangle in the pair may be resolving in the coming days.
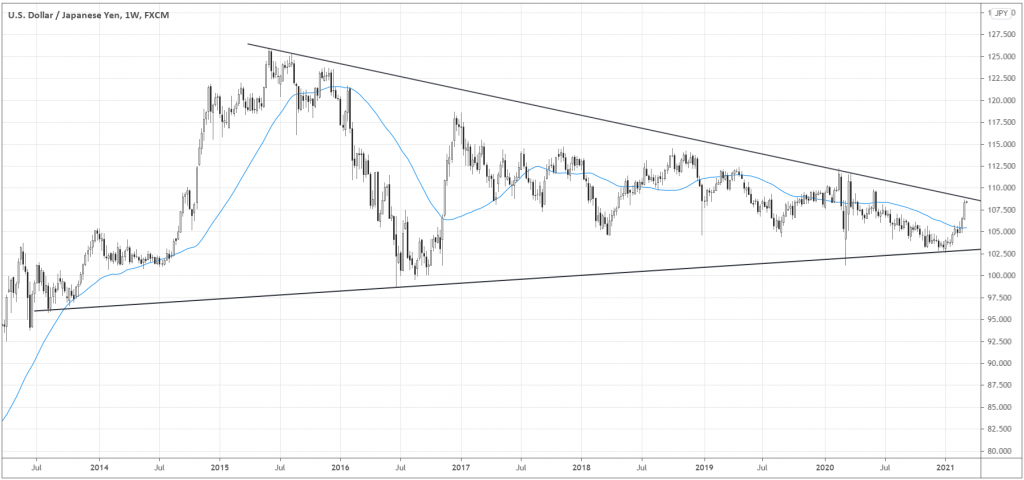
After the USD has been under pressure for the whole year 2020, it finally broke out above the 200-day Moving Average, giving us a bullish bias on USD against JPY.
As the pair is testing the upper boundary of the triangle, it’s a good time to look closer into the pair as the massive breakout could happen in upcoming days.
The epic technical milestone that is likely to give us strong evidence of the pair’s bullish trend is the key level 110.0. Look at how the market has interacted with the level since the end of 2014.
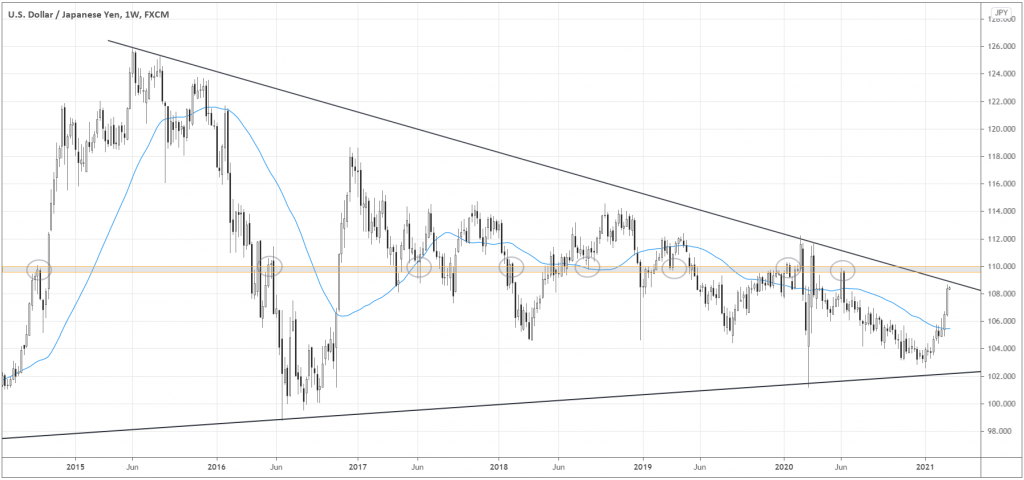
If the pair closes above 110.0, we can expect a powerful upward momentum afterward, which would mean numerous trend-following opportunities for traders on every timeframe.
Let’s look closely at the price action locally to see how the market may play out before the actual breakout occurs, if it does, of course.

In the daily chart above, the market is trending higher, approaching sellers’ possible congestion between the symmetrical triangle’s boundary (black inclined line) and the 110.0 price level.
Notice how the intraday volatility (the last several daily candles are bigger than their predecessors) has been growing since the market broke out above 107.0. After such a powerful move, it’s natural for the market to digest the gains forming a correction or consolidation. The logical area for that to happen would be between 110.0 and 108.0.
Overextended trend? No problem!
Swing and intraday traders should be fine buying the market that looks overextended on a daily time frame. The uptrend is strong. What is wick on daily could be a satisfactory risk-to-reward trade on the four-hour chart or lower.
The recent economic data release might also add fuel to the on-going trend. Look at the market’s immediate reaction to sharply better-than-expected Non-Farm Employment Change data (379K actual versus 197K forecast). The circled candle is the hour of the data release.

Although the initial buyers were overpowered by the overhead supply from the triangle’s boundary resistance area (see the inclined black line), the market wasn’t discouraged much and continued pushing higher, which is another evidence of the resilience of the trend on a day-to-day basis.
Conclusion
Although it may seem that the uptrend in USD is at hand, traders should stay particularly vigilant about running into safe-havens as the underlying strength of the risk-seeking sentiment is still there, as can be seen in yields’ uptrend. For those eager to buy USD, the symmetrical triangle resolution in USD/JPY could be a good option.


