The sentiments were mixed last week, as risk assets closed the week strong overall, although USD put some of them under pressure, completing the breakout of the Head and Shoulders reversal pattern in DXY.
The breakout has failed to sustain the momentum so far. As you see in the illustration below, the DXY closed the Friday session on a bearish note, forming a big black full-bodied candle testing the pattern’s boundary at 91.00.
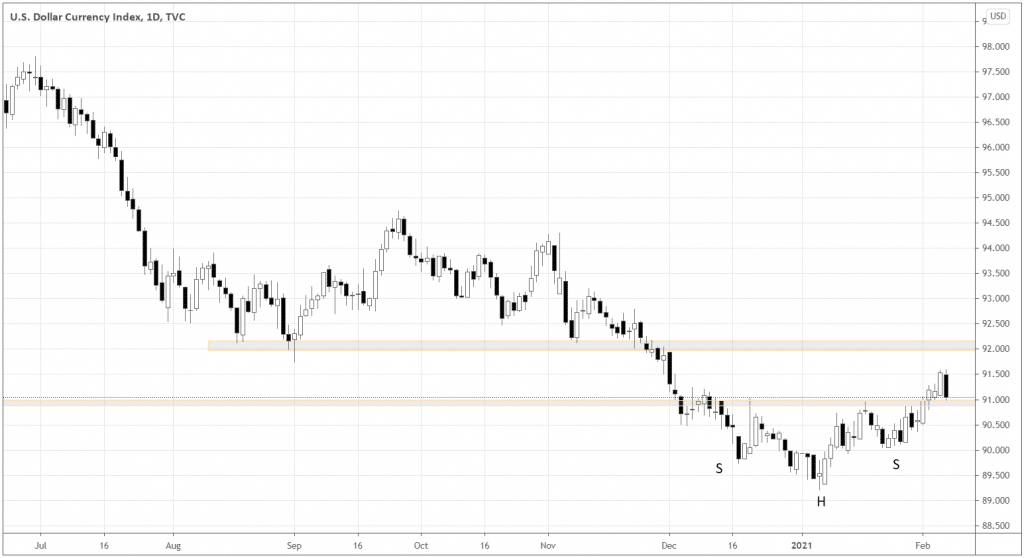
For those seeking to short USD, any further candles close below 91.00 should give more evidence of the failed breakout and opportunities to buy risk assets.
Why buy the Mexican peso?
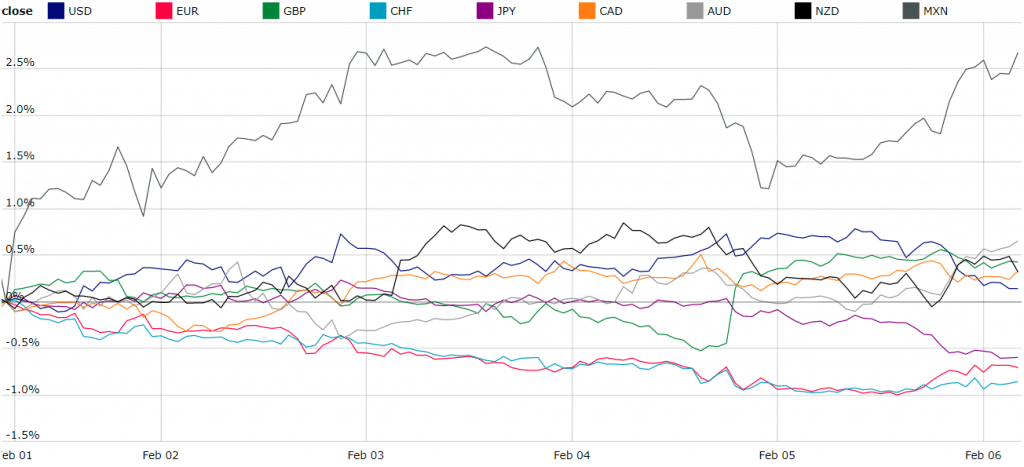
As we’re looking for a USD counterplay, let’s analyze the various Forex risk-assets in terms of their relative strength to each other. Below is the Currency Index, which represents the evolution of a currency relative to the entire forex.
The first line that particularly stands out in the chart above is the dark grey one, the Mexican peso (MXN). As you see, MXN finished the first week of February strong, showing a relative growth of over 2.5% compared to the Majors.
What are the possible reasons for the MXN relative strength?
Mexico is an export-oriented economy, which heavily relies on oil market prices. The oil has been performing exceptionally well since it broke out at $30 and crossed above the Moving Average in May 2020 (see the Brent oil chart below).
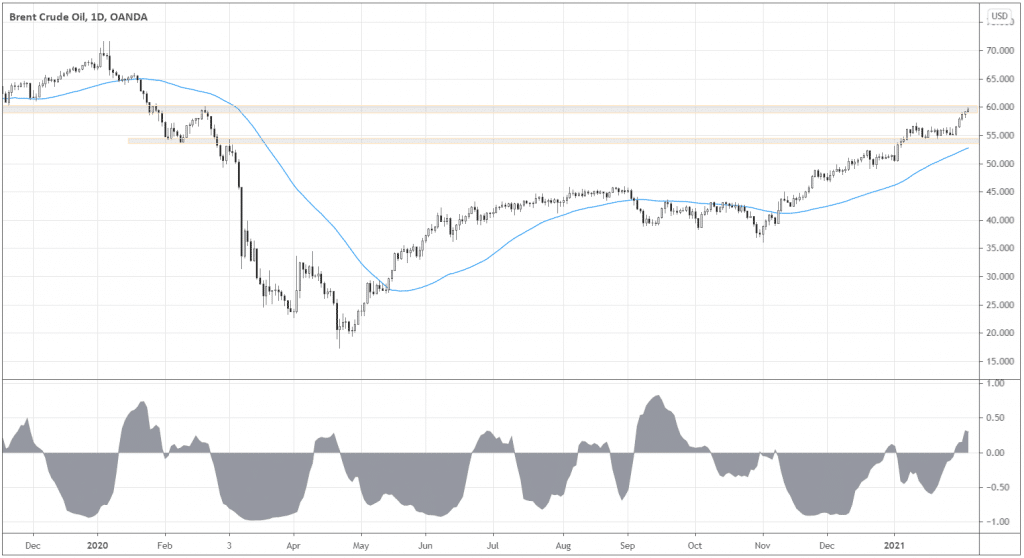
The major oil producers are doing a good job adjusting the oil supply in recent months. Any updates about the COVID-19 vaccines adoptions and reopening the economies should propel the oil higher, thus supporting the Peso. Although correlations tend to change over time, looking at the prevailing negative correlation of Brent and USD/MXN (see the grey indicator in the Brent Crude Oil chart above), we can expect Peso to continue growing along with the oil.
Why not simply buy oil futures then? I’d say it’s not all about oil. MXN started showing strength even before oil went berserk, crashing into negative prices. Mexico seems like coping with the pandemic relatively better than the US. The number of Mexico and the US coronavirus cases per 100,000 population is 1480 vs. 8492, respectively (as of February 8th).
Another possible factor of MXN strength is the attractive interest rate – 4.25% versus 0.25% in the US, offering a nice carry trade opportunity.
The technical picture – how to short USD/MXN?
As we’ve found out previously, there are nice underlying reasons to own Peso. Let’s look at the pair’s technical picture and see how we can manage the risk and have our possible trade entry trigger.
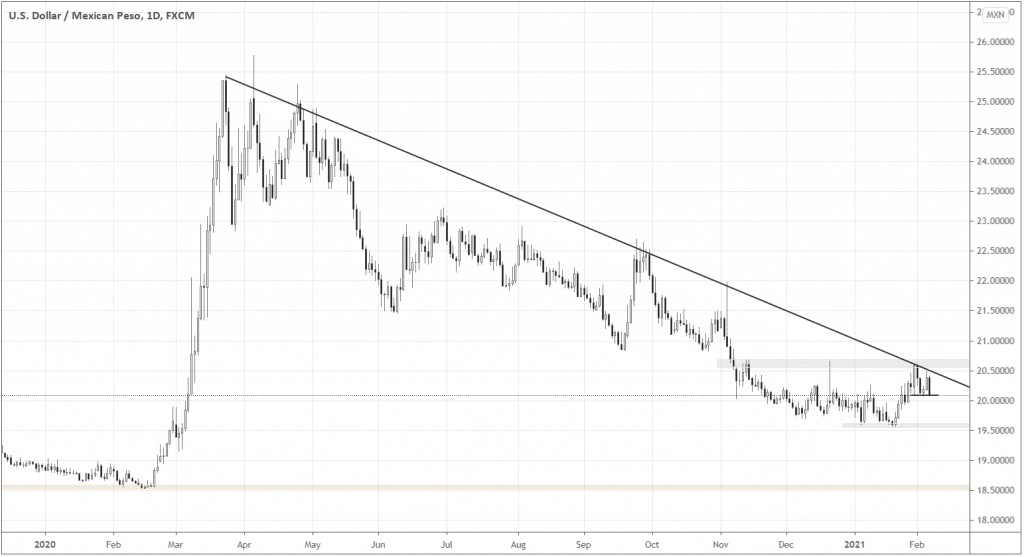
In the USD/MXN Daily chart above, you can see the long-term downtrend that has been respecting its trendline (inclined black line), never strongly closing above it.
Notice that the last retest of the trendline coincided with the local resistance’s retest around 20.5-20.6. A good place to set a Stop loss order would be above 20.6.
You can use a possible breakout of the short-term support (a short horizontal black line) right above 20.0 as an entry trigger.
The local support at 19.5 may be the first milestone, which would suggest the type of your subsequent trade management. Ideally, the market should break 19.5 by closing below. A possible warning scenario would be piercing through 19.5 and still closing above the level. In this case, you may move your Stop loss lower, possibly to the breakeven.
The ultimate trade target would be near the long-term support of 18.5, providing a 1.5-2 risk-to-reward ratio.
Conclusion
A failed H&S breakout offers opportunities to buy relatively strong risk currencies. Currently, one of the strongest risk currencies is MXN. The strength in oil prices and a somewhat better situation with coronavirus cases in Mexico could be factors that have been strengthening MXN against the USD. The pair’s technical picture gives clues of where to set a stop loss, the profit target, and how to manage the position in between.
