Supply and demand trading is a unique approach to conducting technical analysis, but it is the hardest to master. This article will provide a brief overview of what this strategy involves, the crucial confirmation factors to increase the probability, and three recent chart examples to reinforce the previous discussions.
What is supply and demand trading?
Popularized by Sam Seiden, supply and demand is somewhat of a novel trading methodology where analysts observe zones of previous inclines and declines and anticipate identical moves playing out again more significantly in the future.
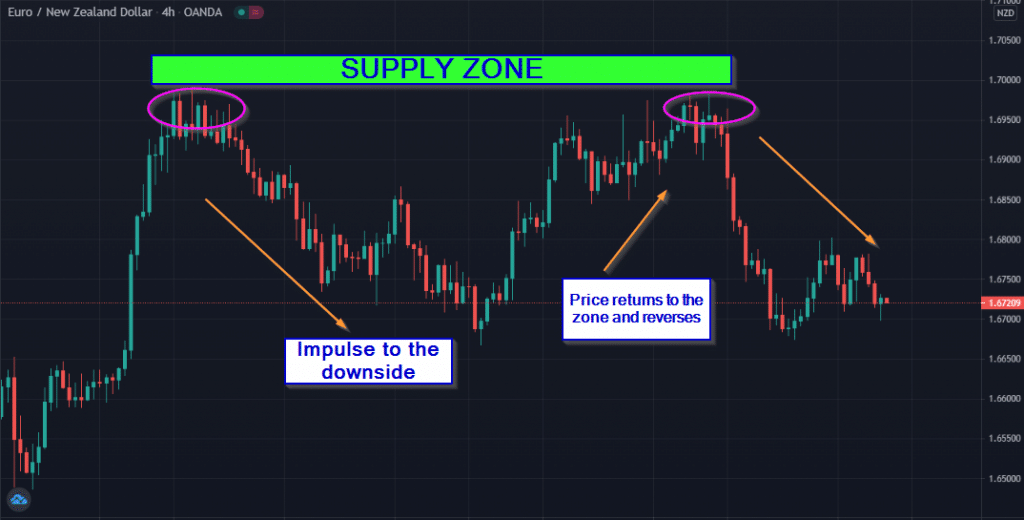
A supply zone is a resistance area where price has previously exhibited an up-trending impulse, representing a place of selling interest and a shift to more short positions than long ones.
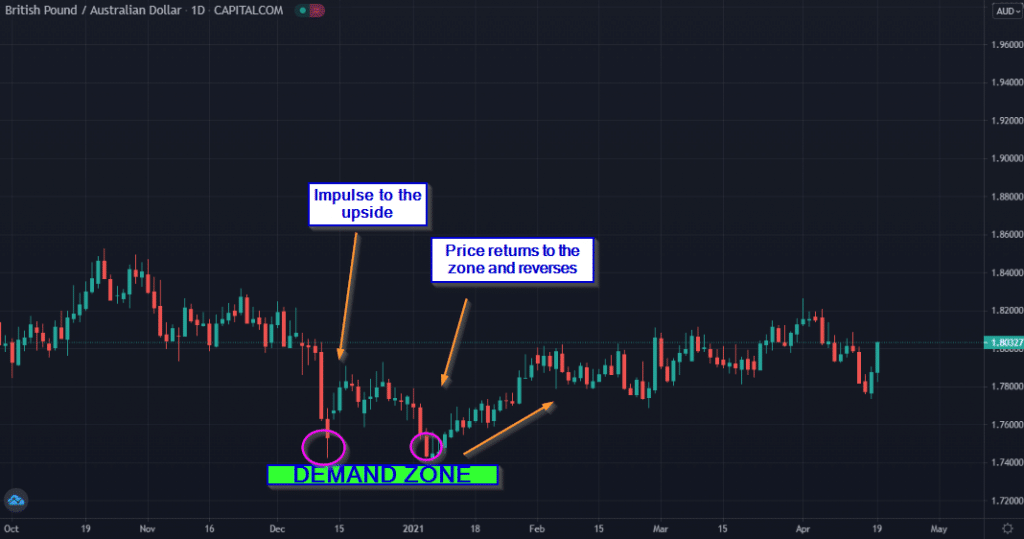
Conversely, a demand zone is a support area where price has previously shown a down-trending impulse, signaling a level of buying power and a shift to long positions rather than short ones.
The two key components for success with supply and demand trading
As with any methodology, we always have to combine it with something else. Because supply and demand involves understanding order flow, we need something else in this regard. Unfortunately, there aren’t many options in forex, except for using the Commitment of Traders (CoT) report.
The CoT
The CoT is a weekly report published by the CFTC (Commodity Futures Trading Commission) reflecting the net long and short positions of various retail and institutional traders in the forex futures markets.
Fortunately, this instrument correlates positively with the more commonly traded and popular spot forex. It is one of the few approaches available at our disposal for seeing what the ‘big players’ are doing.
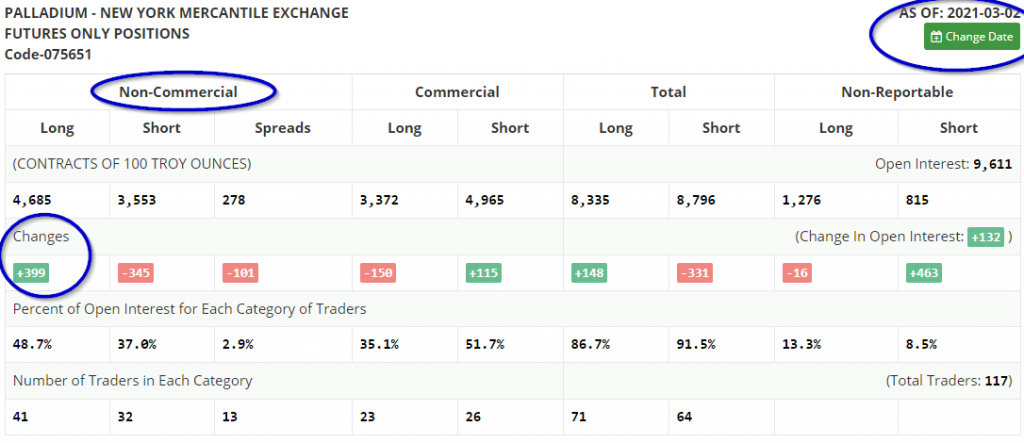
There are different categories of traders in the CoT, though the most significant is the non-commercial, consisting of speculative institutional and retail investors. Essentially, one is looking for the non-commercial section to add new positions outweighing the other orders.
So, for instance, in a supply zone, we want these traders to add more sell than buy orders (and vice versa for demand zones). Sometimes, in a supply zone, the non-commercial group may remove more longs than shorts.
At face value, this might suggest possible selling pressure. However, the signal becomes more substantial when this group adds noticeably more sell than buy orders (and vice versa for demand zones).
Entry parameters
If we consider the components for entry, it’s paramount to always enter after a bull or bear trap. A bull trap is a spike through a supply zone, followed by a sharp move in the opposite direction; a bear trap is a spike through a demand zone, followed by a strong move in the opposite direction.
They are caused primarily by two reasons: stop loss hunting from large financial institutions and false breakouts. These traps make supply and demand trading work well because after establishing whether the non-commercial section has added new orders in the desired direction, they need stop losses for liquidity.
We should enter after seeing an engulfing candle or pin-bar for further confirmation. Such patterns often result because of bull and bear traps.
Real chart examples
As previously mentioned, we’ll see the utilization of the CoT and the bull/bear traps play out in the following three examples.
Palladium/XPD/USD buy trade (05/03/2021)
In the first image below, non-commercial traders added 399 contracts of long positions and removed a noticeable 345 lots of sell orders on 02/03/2021, a confident indication of potential bullish movement in this zone.
On 23/02/2021, there already was a demand zone, although confirmation from the CoT only came about a week later. When the market returns to this area, we can see a nice pin-bar, an often reliable sign of a bear trap in this case.
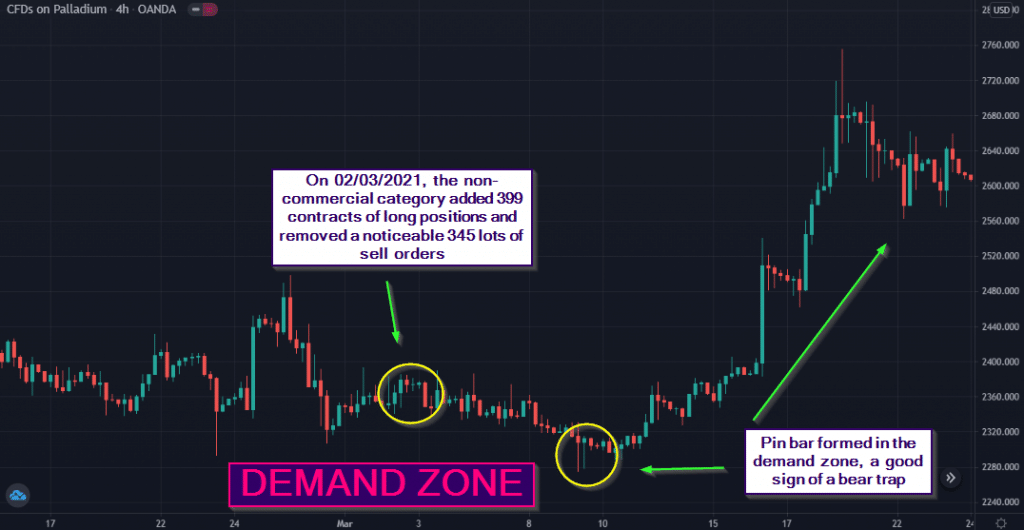
Based on the volatility range at the time, the stop loss should have been around 500 pips. Assuming a trader could have held the position towards the $2,700 area, the reward would have been about 1:10, which is about 5000 pips away from the entry point.
EUR/USD sell trade (18/03/2021)
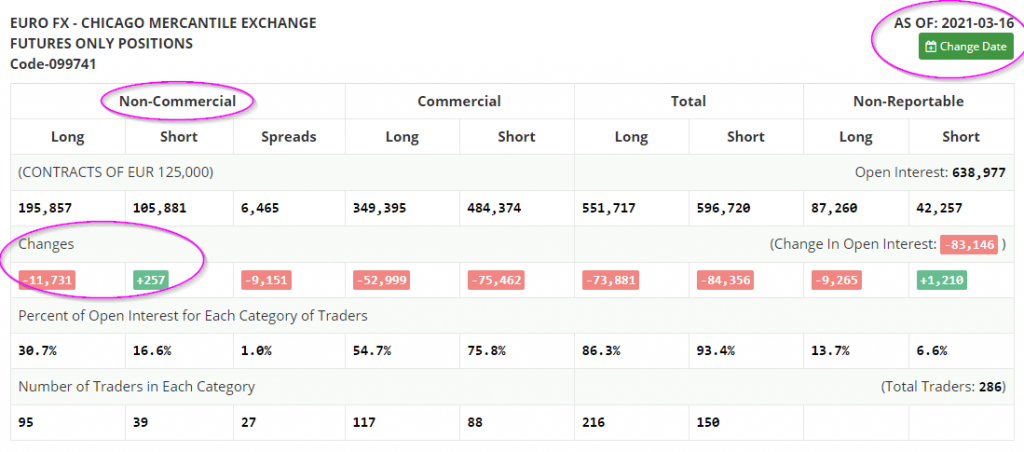
In the first image below, non-commercial traders added sell orders worth 257 contracts and took off a remarkable 11,731 lots of buy positions on 16/03/2021, a massive sign of selling pressure around this time.
On 11/03/2021, a supply zone appeared on the charts. As expected, we have to wait for the price to hopefully return to this area after seeing what the CoT has reported. After establishing the zone, we would wait for the bull or bear trap as the market returns to this area.
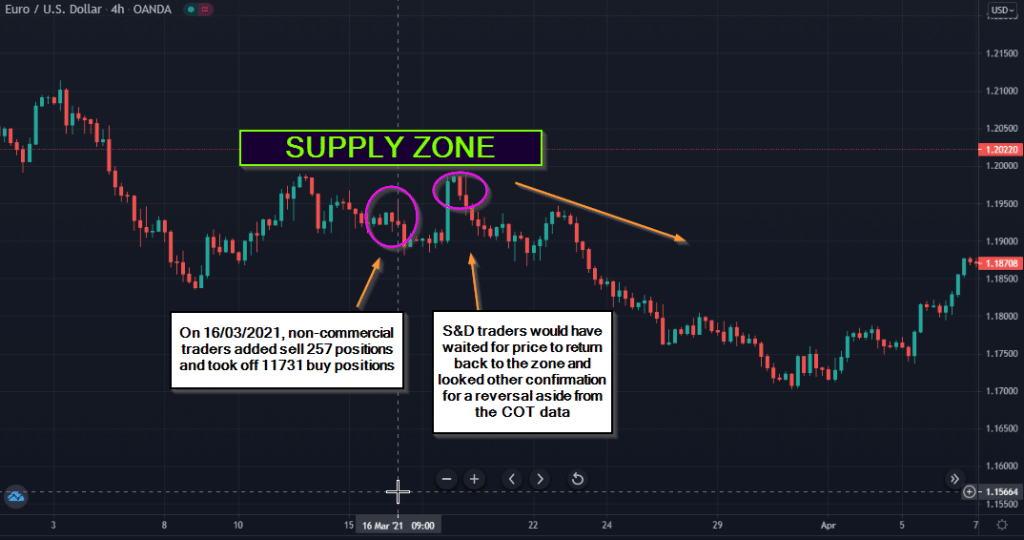
In the second purple ellipsis from the left, we see a large bullish Marubozu candle going through the supply zone, exemplifying a classic bull trap where breakout traders and those using tight stop losses get ‘sucked in.’
After this, there is a bearish engulfing candle, a sign the bears may have begun dominating at the time. An order with a stop ranging from 30 to 50 pips, depending on the volatility, resulted in a 1:10 to 1:6 risk-to-reward position assuming one held the position for the whole +/- 300 pip move.
CHF/JPY buy trade (24/03/2021)
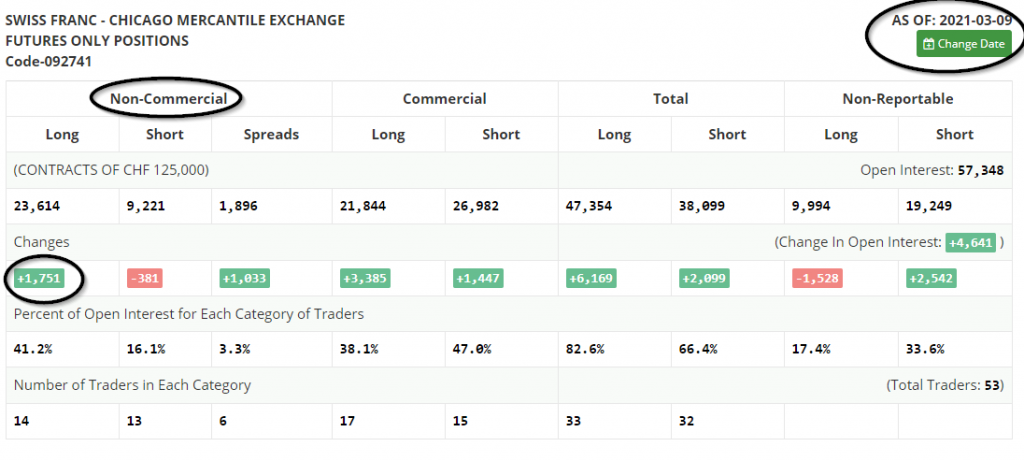
In the first image below, non-commercial traders added 1,751 contracts of long positions and decreased 381 lots of sell orders on 09/03/2021, a confident suggestion of potential bullish movement at this level.
On 05/03/2021, a demand zone appeared on the charts. As expected, we have to wait for the price to hopefully return to this area after seeing what the CoT has reported.
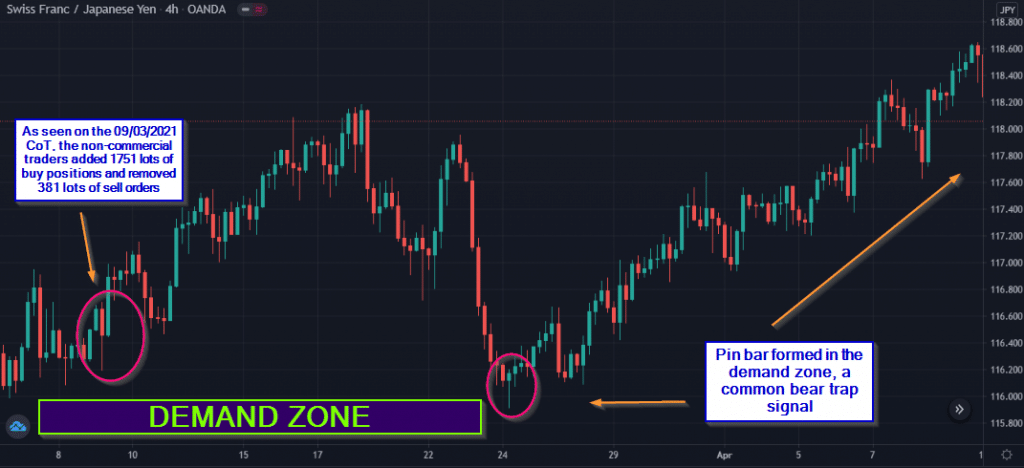
When it eventually did, note the well-defined pin bar, a clear indication of a bear trap. Our entry ought to have occurred after this moment. Based on the volatility range at the time, the stop loss should have been somewhere between 35 and 50 pips.
Assuming a trader planned to hold the position with a roughly 300 pip target towards the 118.860 level, the reward may have been anywhere from 5 to 8.5 times the risk.
Final word
Of course, there is a bit more with identifying the zones correctly in the first place. Fortunately, there are indicators to help traders in this regard. Arguably, the two most critical factors are the CoT report and the price action occurring when markets return to the zones.
As with any trading strategy, supply and demand does also fail, reinforcing the importance of strict money management and never risking substantially in any given trade.


