- Snap is witnessing a record growth in demand for its advertiser services, as well as its products. The company is not letting the demand slide because it is continuously adding product ranges, including Games, Minis, and Snap Maps.
- 2020, and perhaps the years ahead, look great for Snap in revenues and community expansion. Q3 results beat street estimates as well as both the bottom and top lines. The possibility of revenue maintaining the growth trend for the fourth quarter is clear.
- Besides the strong fundamentals, Snap’s technicals are in total agreement in terms of the stock’s direction. The stock is trending upwards across all timeframes, which provides a strong case for further growth. Investors are already aware of this possibility, and they are taking up positions in SNAP aggressively.
Snap Inc.: The company and its products
Snap Inc. (NYSE: SNAP) describes itself as a camera company. Its leading product is Snapchat, an application that enables users to communicate with their family and friends by taking beautiful images of themselves and making short videos. Snapchat users call these short videos and images Snaps.
Within the Snapchat app, Snap provides other functionalities such as a camera, a tool to fancify Snaps, and a Chat function. The Chat function also supports video and voice calls. Over nine years of innovation, Snap has added new features to Snapchat, including Snap Map, Memories, and Snap stories, among many others.
However, the icing on the cake is the hardware product called Spectacles, which uses augmented reality (AR) to enable Snapchat to capture human-perspective photos. The company itself is ten years old, and it IPO’d in March 2017 at a per-share price of $17. In the past 24-hours of trading, the SNAP stock had closed at $45.38.
Snap has a strong fundamental posture
Investors have plenty of parameters they consider before settling for a particular stock, but none is as important as the underlying strength. It is informed by strong fundamentals that project a business’s strength far into the future. In this regard, Snap is doing quite well.
Over the past five years, Snap has posted a robust average revenue performance per user and total revenue. In 2015, a single Snapchat user generated an average of $0.59 in revenue, and the resulting total revenue was $59 million. Fast forward to 2019, average revenue per user was up 1,305% to $8.29, which translated into $1.7 billion in total revenue.
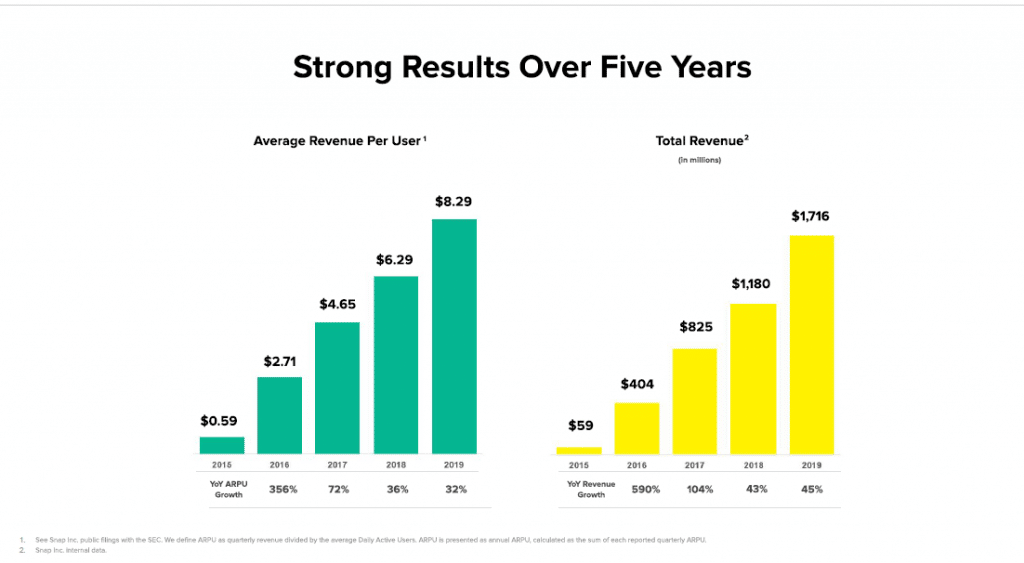
In Q3 FY 2020 financial results, Snap bested both its bottom and top lines, as well as beating street estimates. Many people were locked away in their homes during the pandemic period, which drove them to Snap and other similar platforms. As a result, Snap’s revenue in Q3 grew 52% year on year.
According to Snap’s figures, its community of average daily users grew by 18% YoY in Q3 to 249 million. Also, the platform reported that about 90% of its community are 12-24-year-olds. Interestingly enough, this age group makes up the largest demographic in its key markets, especially the United States. Therefore, one can argue that Snap has the potential to scale higher heights in terms of DAUs.
Snap’s financial position is another key pillar of the company’s immense growth potential. Snap’s total assets are worth $4.82 billion against $2.71 billion of liabilities from the latest financial report. Moreover, Snap has a debt-to-equity ratio of 75.1%, which implies a lower risk.
How does Snap look from the technical perspective?
It sounds quite reassuring to note that Snap’s technicals fully support the company’s fundamental posture. The last three months of trading have been great for SNAP, whether you look at the 4-hour, 1-day, or 1-month period price chart.
The 1-month price chart shows SNAP in a strong upward trend since January 2019. In 670 days, SNAP has advanced 774.95%, and there seems to be no stopping.
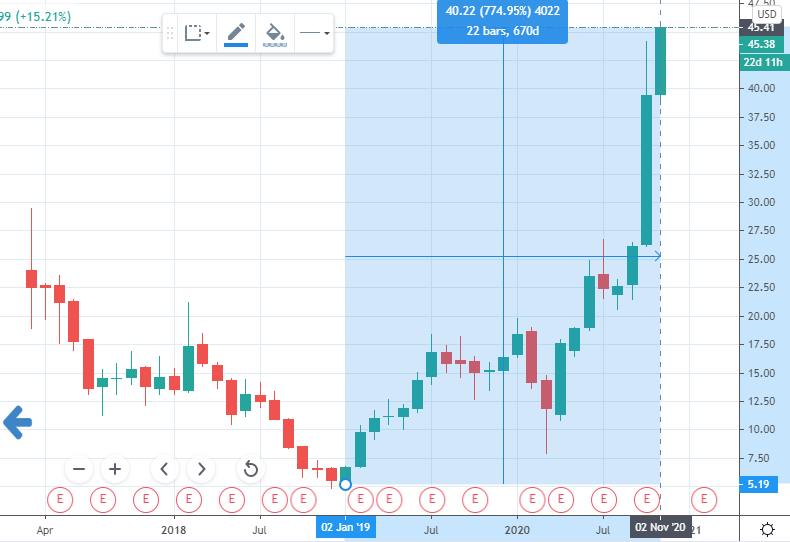
SNAP’s uptrending price action has been steeper since the dip in March when the market was reacting to the coronavirus pandemic’s economic shock. If you wondered how this uptrending market has been behaving, then a look at the weekly price chart has some great insights.
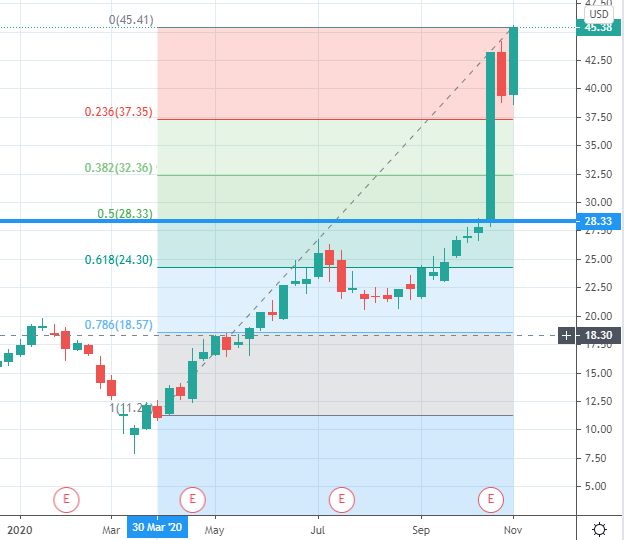
If we plot Fibonacci retracement levels between March 30 to date, it becomes apparent that SNAP’s price action has been insistent in its upward push. Specifically, the company’s fundamentals have played a massive part in ending the stock in the market.
For example, the stock launched into a three-month-long uptrend on the back of strong numbers in the Q1 FY2020 results. In the results, Snap reported revenue of $462 million, which was 44% higher than Q1 FY2019. Immediately after the report release, SNAP jumped 20% after the market closed.
However, SNAP seemed unable to touch the 0.5 Fibonacci level during this period at $28.33 (blue line in fig. 3). Q2 FY2020 results seemed to have dealt the stock a huge blow, but the third quarter delivered a sterling performance that, finally, enabled SNAP to vault above fib 0.5.
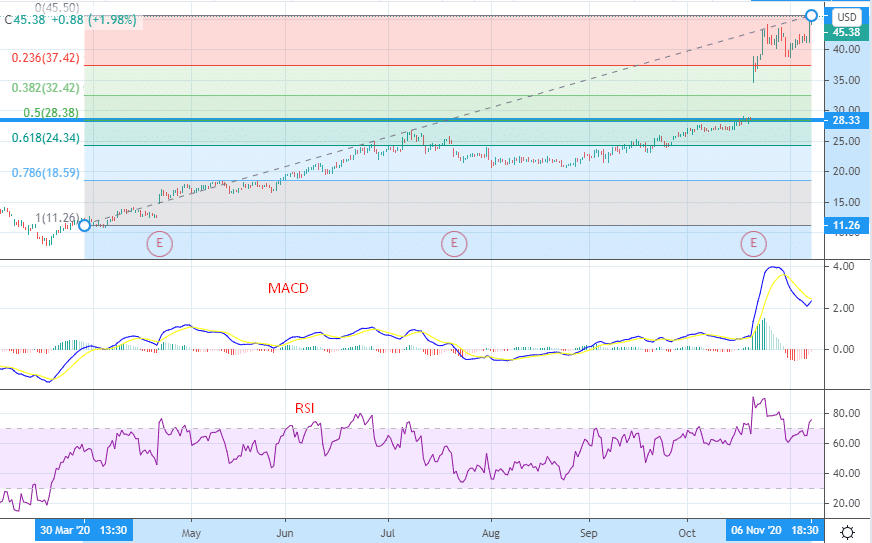
Over nearly eight months of trending, numerous entry opportunities have sprung up. Consider the 4-hour chart below, still with Fibonacci levels superimposed. Further adding MACD and RSI, it becomes clear where entry points lie and where the market is going.
Notice that investors rushed to buy SNAP after the Q3 results. The market was overbought for a few days but then normalized. What is apparent here is that the market still believes SNAP has enough strength to trend upwards for longer, as shown by the MACD edging towards a crossover and RSI edging towards 80. Any time, SNAP looks like it’s a buy.
Conclusion
SNAP is in a steep growth phase, and it seems there is enough strength to touch new record highs before the end of 2020. The stock displays short-term strength, but the long-term posture looks even more appealing. Therefore, our recommendation for this stock is BUY.

