
Last week the markets’ sentiment was shifting towards risk aversion. The risk assets across the board have declined and approached the significant price levels. The US and European indices currently offer classic and straightforward setups to play out a possible correction.
The Rebound Setup in a Nutshell
Below are two major indices – DAX and S&P 500. Both are staying at their support levels (grey areas around the current prices).
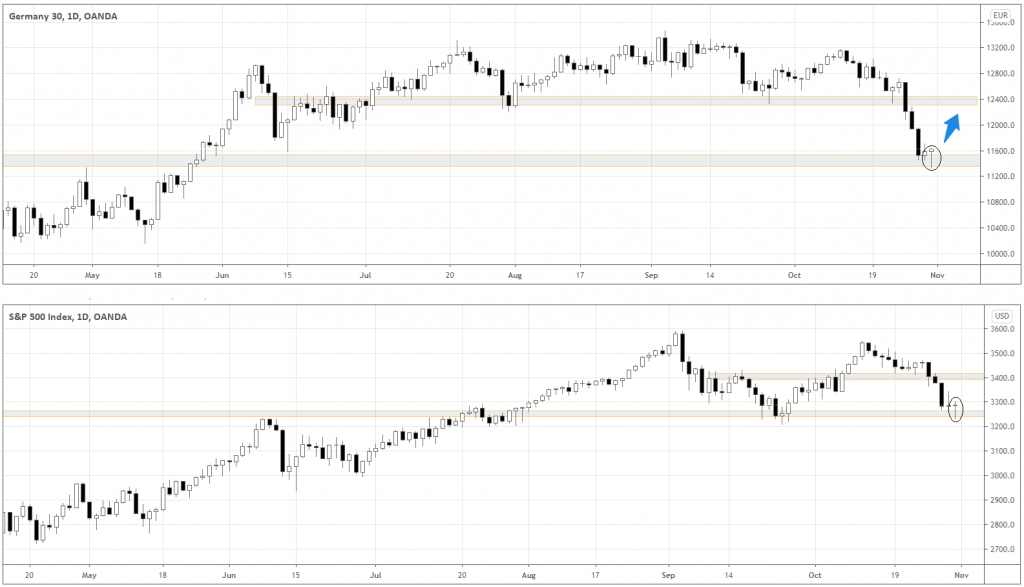
The idea is to buy with the protective sell stop below Friday’s low – around 11300 and 3230 for DAX and S&P 500 respectively. The profit target would be around their respective resistance areas around 12400 and 3400. The potential risk-reward, therefore, is 2:1 in both indices.
There are two ways to place this trade:
- Buy as soon as possible, at the opening or pre-market. The risk-reward will still be maintained at 1:2, sacrificing the win rate.
- Buy the index after the market holds above Friday’s high – either buy intraday if the market holds above the previous day’s high for several hours, or buy after the next daily candle closes above Friday’s high. In this way, you can increase your hit rate but lose some move potential, so the risk-reward can possibly decrease to 1:1 or less.
Which One To Buy?
Although S&P 500 historically has a smoother price action than DAX. This time, I believe, DAX looks more attractive to buy. Here is why – the first hint comes from the kinds of the last daily candles. DAX formed a clearly bullish “hammer” candlestick pattern while S&P 500 formed something that looks more like a “Doji” candlestick pattern, which carries a more neutral character.
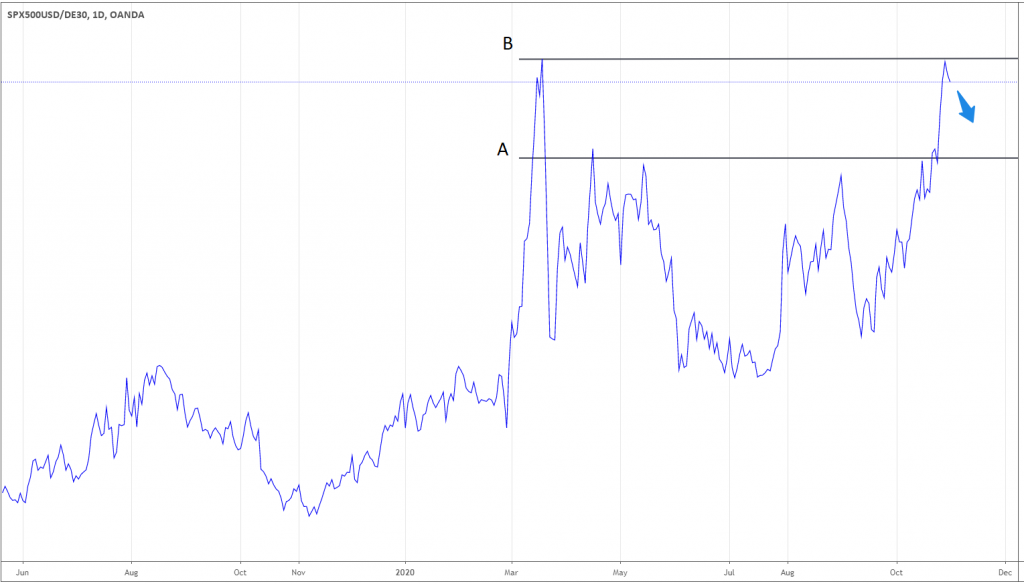
The comparison of these candlestick patterns leads to the analysis of the bigger picture of the relationship between the American and European indices. Below is the chart of S&P 500 against DAX.
What can technical analysis tell us here? Although the overall trend is up, the relationship reached the Resistance “B” and showed the signs of rejection as the chart declined on Friday. From this chart, we can expect the relative weakness of S&P 500 in short-term until the ratio reaches the support “A.”
As the United States presidential election will be on Tuesday, November 3, it’s understandable why the American stocks are relatively weaker. American fund managers are unloading risk assets due to the uncertainty of the outcome of the elections, as the US economy will likely be more susceptible to the risks associated.
Summing up
Stock Indices offer clean rebound setups with an acceptable reward potential. The candlestick patterns and the overall relative strength of DAX suggest that it’s more reasonable to choose DAX over S&P 50,0 to go long in this short-term trade. The fundamental factor like the US presidential election adds to the uncertainty of S&P 500, thus justifying its relative weakness.


