Investment thesis
- South Africa has always been a developing nation compared to its first world counterparts. If we look at the charts historically, ZAR (or the South African Rand) has always been weaker. Prominent ZAR pairs include USD/ZAR, EUR/ZAR, and GBP/ZAR.
- This idea is a long-term one, and it will be interesting to see if the pairs mentioned above can go back to their previous highs in the future. South Africa’s economic climate has been bleak for a long time, with no prospects of getting better. This weakness presents a good trading opportunity for those willing to take advantage of it.
The idea behind the investment
Over the last few months, ZAR has improved tremendously against mainly USD, EUR, and GBP. In April 2020, USD/ZAR hit a record high of R19.35, which can be attributed mostly to the coronavirus and Moody’s downgrade ratings during that period.
Since that period, ZAR has strengthened somewhat surprisingly (as low as R15.36), although it shouldn’t be so. Most of the strong trends in various financial markets behave similarly. Typically, after a huge push, the markets retrace back considerably, but rarely to the point where the bigger trend has changed.
So, although the market is technically in a downtrend on the daily chart, the weekly and monthly charts are still firmly bullish. The images in further discussions demonstrate this characteristic clearly.
About the South African rand
We use the code, ZAR, when expressing the South African rand, the official currency of South Africa. The currency is also used partially in Namibia, Lesotho, and Eswatini, the latter two of which are South Africa’s landlocked states.
In the forex markets, the currency forms part of the exotic pairs, consisting of so-called developing nations. When most people speak of the rand, they will use the exchange rate against the US dollar. USD/ZAR is the 20th most traded currency pair globally.
Historically, the rand has generally been weaker against the dollar ever since the inception of the pairing in 1961.
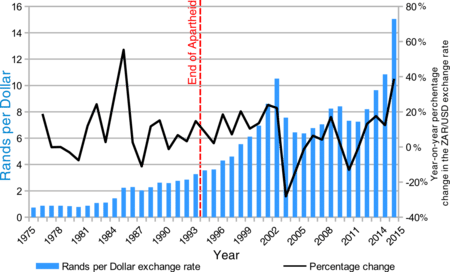
The currency has been marred primarily by economic problems in South Africa. The USD/ZAR exchange rate has seen record highs, particularly in 2001, 2016, and most recently, 2020.
Foreign investment has decreased gradually in the country due to a lack of confidence in the national government’s policies, and this usually presents opportunities for traders or investors to sell the currency.
Fundamental analysis
We’ve already covered the brief historical fundamentals of USD/ZAR, which are significant. The current fundamentals are the only missing piece of the puzzle. We can judge the economic landscape of America and South Africa through two lenses: the interest rate and employment figures.
Interest rates
Regarding the former, both respective central banks have taken identical measures of maintaining reduced interest rates (0.25% for the USA and 6.25% for South Africa) in 2020 primarily because of the Covid-19 pandemic. Therefore, we cannot take advantage of any disparity here. We shouldn’t expect there to be a change in the rates for the rest of the year.
Employment
If we look at jobs, this paints a different picture that exemplifies vulnerability in South Africa’s economy. Published on the 12th of November, 2020, Q3 findings, once again, hit another record high – this time, of 30.8% unemployment.
In contrast, America’s unemployment rate dropped from 7.9% to 6.9%. Despite that these levels are well above those before the pandemic, there is some growth compared to South Africa.
Technical analysis
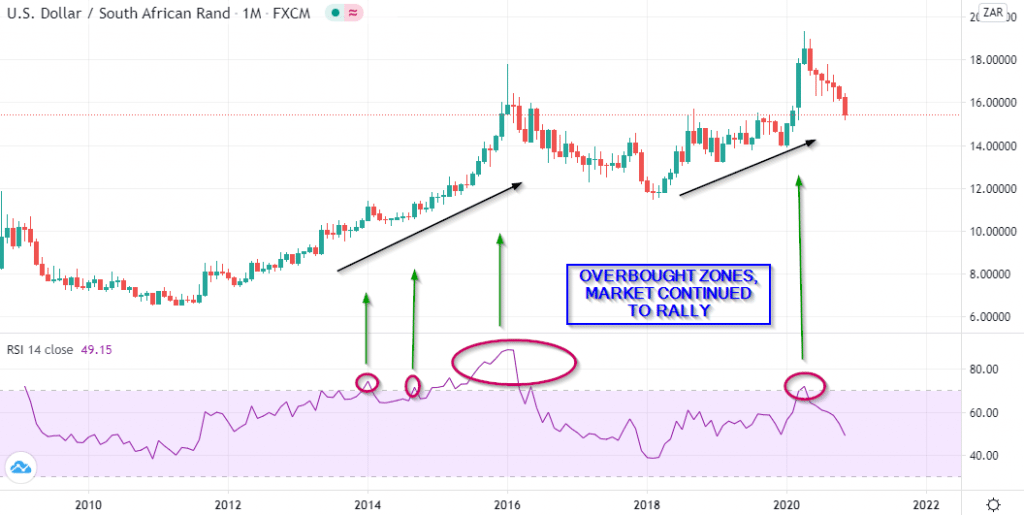
Technically, we are referring to the monthly time-frame where we can observe a strong uptrend. The main indicator for analysis here is the Relative Strength Index (RSI). Any peak above the 70 lines (overbought) signals a bullish market, which is more significant on a time-frame as high as the monthly.
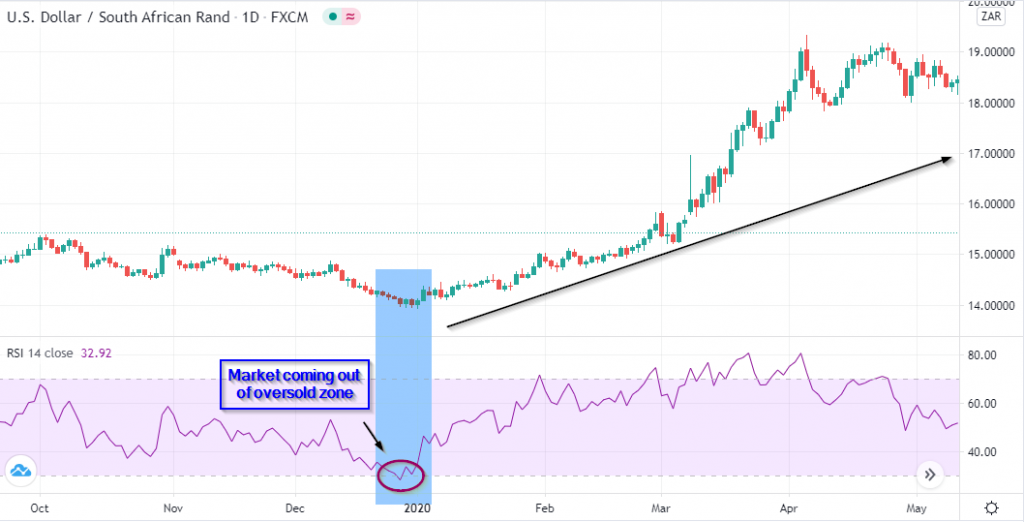
On the daily time-frame, the peaks below the 30 line would typically mean a bearish market (oversold). However, on higher time-frames, when the RSI line goes above the oversold level, there is a chance for the dominant trend to resume (see below image). This distinction applies only to time-frames starting from the daily and above.
These reasons are simply the main motivations for going long on this pair from a technical perspective.
Potential risk/reward scenarios
This trade opportunity is long-term, and we should expect to hold the position for at least a month, but likely longer.
However, since not everyone can hold trades for extended periods, this article presents two set-ups: medium-term (at least a month) and the other is long-term (at least three months).
Scenario 1
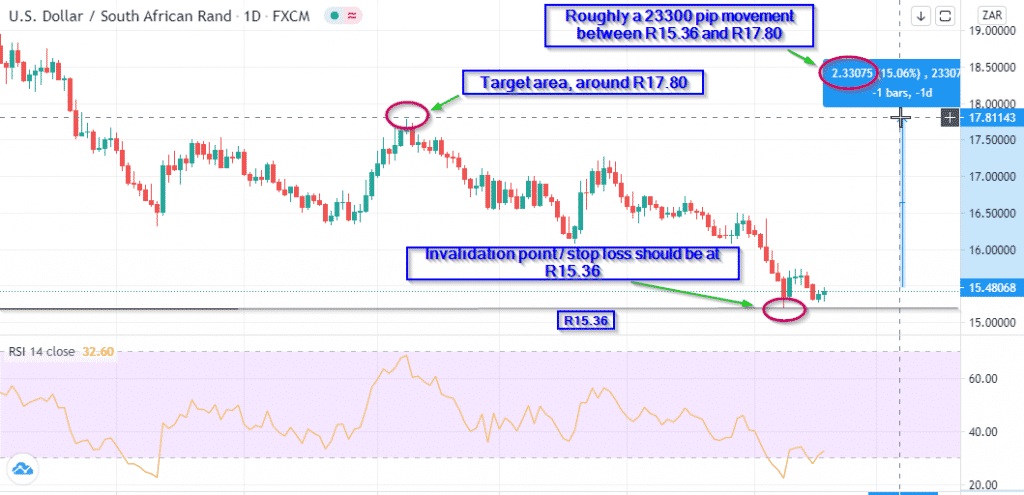
The image above shows a chart of USD/ZAR. In scenario 1, assuming the market respects the R15.36 level, our desired target would be R17.80 for the medium term. The invalidation point is R15.36. An ideal entry should allow for a stop-loss between 26,000 and 40,000 pips in the distance. While the stop loss can be higher, the potential reward suffers.
Regardless, the stop must be at R15.36, including the spread, i.e., the sum of the stop loss and the spread distance. Assuming the stop loss is around 2,600 pips, the potential risk to reward is around 9:1 if the market moves around 23,800 pips to the target (or could be down to 7:1 if the stop is wider to accommodate the R15.36 invalidation point).
Scenario 2
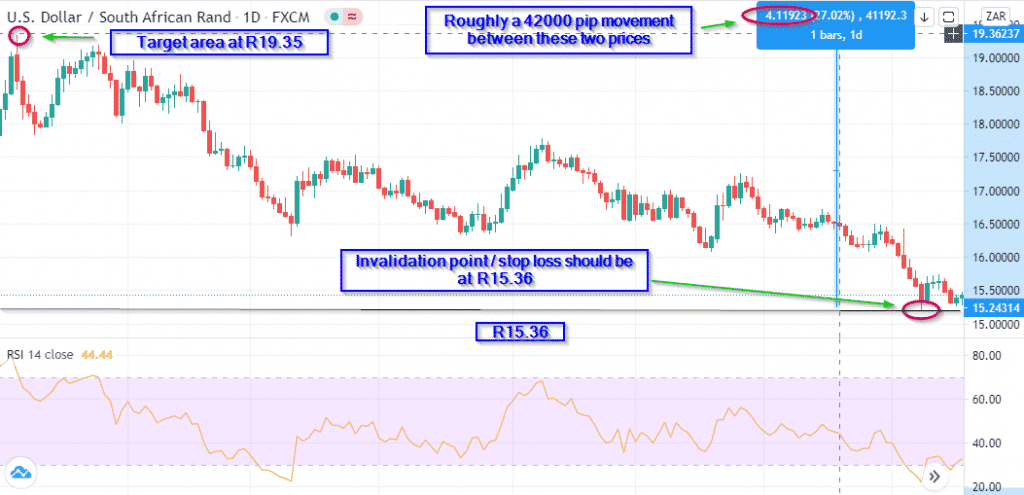
For the long-term scenario, we would audaciously target the record high at R19.35, which represents about a 42,000 pip move depending on the stop loss size. The potential risk to reward is between 12:1 and 15:1, again, depending on the stop loss size.
This second plan may take a few months to materialize. To stay in the position for both situations, assuming the market is well above R15.36, we’d simply move the stop to the 23.6 Fib level (including the spread).
Conclusion
It’s going to be interesting to see how the market reacts towards the tail end of 2020. The technical analysis points to an uptrend resumption of USD/ZAR. Fundamentally, South Africa continues to face woes. Although America is not much different, they are statistically better.


