The hull moving average (HMA) is a technical indicator that reduces the lag and enhances the smoothness of a moving average. Similar to the other moving averages, the HMA is helpful in identifying the direction of a security’s price. However, it does not predict the price movement. The indicator is also helpful in pinning the suitable trade entry or exit points.
The key difference between the HMA and other moving averages, such as the simple moving average (SMA), is that it is extremely responsive to changes in prices. By using the weighted moving average (WMA), HMA prioritizes the most recent data.
How to calculate the hull moving average
The first step in obtaining the HMA is to calculate two weighted moving averages (WMAs). To compute the WMA, you need to assign a weighting factor to each data point. The most recent one should have the most weight, ensuring that the total is 100% or 1. Next, multiply each price with its weighting factor before finding the total. The last step involves dividing the sum by the total weights.
1st WMA= WMA of n/2
2nd WMA= WMA of n
where n is the time frame.
Subsequently, calculate the raw HMA by computing (2*1st WMA) – 2nd WMA.
The third part of the calculation involves smoothing the raw HMA.
HMA = WMA (square root of n) of the raw HMA.
By using a WMA of a lesser time frame (square root of the initial period) to smooth the raw WMA, more value is placed on the immediate data.
Example of the hull moving average
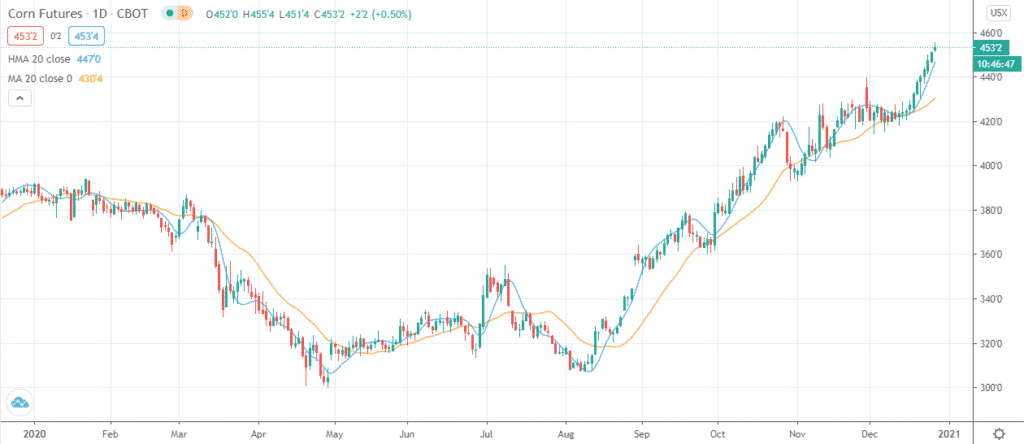
The image above is corn’s daily chart. The blue line denotes the hull moving average, while the yellow one is the simple moving average. Notably, the commodity’s price is above the HMA line. This is an indication that the price is on an upward trend, which is a sign that a trader should open a long position.
As aforementioned, the hull moving average reduces the lag of other moving averages such as the SMA. In the chart above, you will notice that HMA’s lag is lesser than that of the SMA. This is an indication that the former moving average is reacting faster to changes in prices than the latter one.
How to interpret the hull moving average
Like other moving averages, the hull moving average enables traders to highlight a trend in the price of an asset or identify the change in the direction of the price. A rising HMA denotes an uptrend. Similarly, if the moving average is headed down, that’s an indication that the asset’s price is on a downward trend.
A trader can also use the HMA to identify the apt entry point. The approach is especially applicable when the moving average is that of a shorter period. A rising HMA is a sign that the asset’s prices are on an uptrend and that you should take a long position. On the other hand, a descending HMA shows that you should go short.
Notably, traders often use moving averages’ crossover signals (a shorter-period MA crossing a longer-period MA) to decide on where to enter or exit a trade. However, this strategy is not recommended by the HMA. This is because the crossover-based analysis is founded on the fact that the two moving averages have a difference in lag. A suitable approach would be to check if the HMA is headed up or downwards.
Does the hull moving average really work?
When Alan Hull was developing his indicator in 2005, he had one objective in mind: to reduce the lag common in traditional moving averages. By cleverly computing the HMA using weighted moving averages, he was able to reduce the lag, making it more responsive to price fluctuations.
However, the resulting moving average was still not smooth. To remedy this, he chose to use a much smaller number than the period length as the divisor in his calculations — the square root of the period. This resulted in a moving average indicator that followed price movements much more closely, all the while maintaining a smooth curve. Applying HMA to appropriate trading strategies can work out and result in better trading performance.
Does the hull moving average reduce lag to zero?
As highlighted in the aforementioned corn example, HMA has less lag than its fellow moving averages. It follows prices more closely, as it appears to hug the price as it fluctuates. This is the quality that gives HMA superiority over other moving averages.
However, in as much as HMA nearly eliminates the problem of lag, the resulting lag is not zero. This is because, like any other moving average, it is calculated using previous data. This is also the reason why it cannot be used to predict future price movements.
Does the hull moving average indicator repaint?
A repainting indicator is one that constantly changes its values as new price data comes in. Such an indicator tends to use future candlesticks to generate entry and exit signals. Like other moving averages, when the HMA is computed using closing prices, it will tend to fluctuate at the end as a new candle forms. This is because it tends to take each current price as the closing price until the candle is fully formed and a final close is definite.
However, when computed using opening prices, the HMA indicator will not repaint. This is because only one opening price is allowed per candle, so once a candle opens that price will not change.
What are the best settings to use with the hull moving average?
Depending on your trading needs, you can tweak this indicator to display moving averages over any period. However, shorter periods tend to generate noise, which may yield erratic signals. The most stable results are obtained for periods longer than 20. For long-term trading, or to obtain the general direction of the market, it is prudent to increase the period further so as to highlight only the significant trend changes.
Best hull moving average indicator strategies
HMA can be used just like any other moving average to generate trading signals. Let’s look at a few strategies you can employ using this indicator.
Using hull moving average to follow trends
The way to do this is to start by identifying a suitable period to set up your HMA, preferably above 20. Next, identify a trending market, where the price is either trending upwards or downwards. A rule of thumb is that prices will be in an uptrend when they appear above the HMA. Conversely, prices will be trending downwards when they appear below the HMA line.
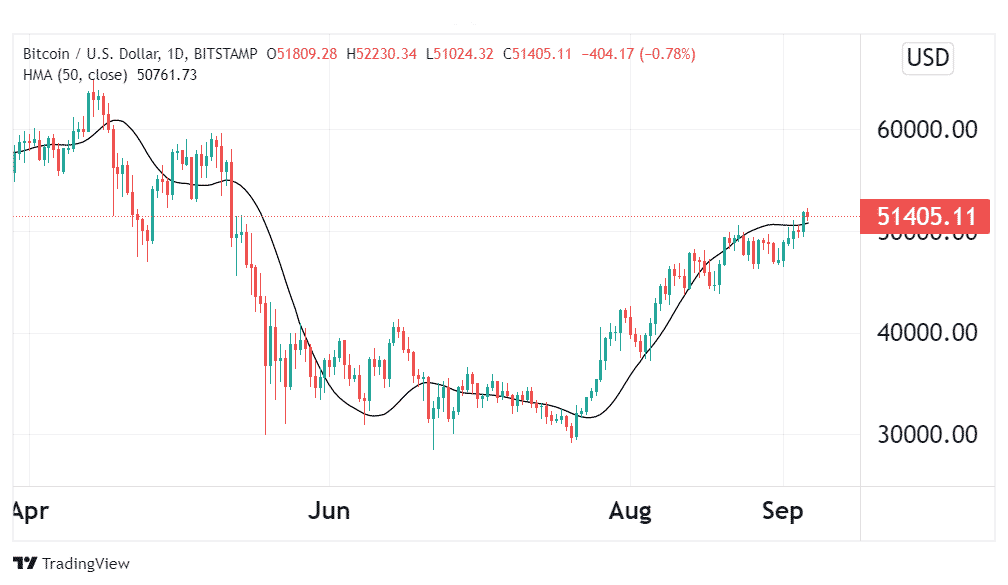
In the daily BTC/USD chart above, you can clearly see the bearish trend when the prices fell below the HMA, and the bullish trend when they crossed above the HMA line. In a downtrend, when prices cross above the HMA line, that’s your signal to go long. Alternatively, during an uptrend, when prices cross below the HMA, that’s your signal to short your open positions.
Recommended HMA settings:
- Period- 50.
Hull moving average crossover strategy
First and foremost, since the crossover strategy is based on lag, Alan Hull discourages using this strategy with the HMA indicator. However, it has benefited lots of traders who’ve used it to generate entry and exit signals.
To set it up, you’ll need two hull moving averages, one shorter than the other. The idea is that whenever these two moving averages cross over each other, a trend reversal is likely to happen. In the example below, you can see the highlighted HMA crossovers and how they correctly predicted a trend reversal. However, this strategy is not always right, so it would be wise to seek confirmation through other strategies before committing to a trade.
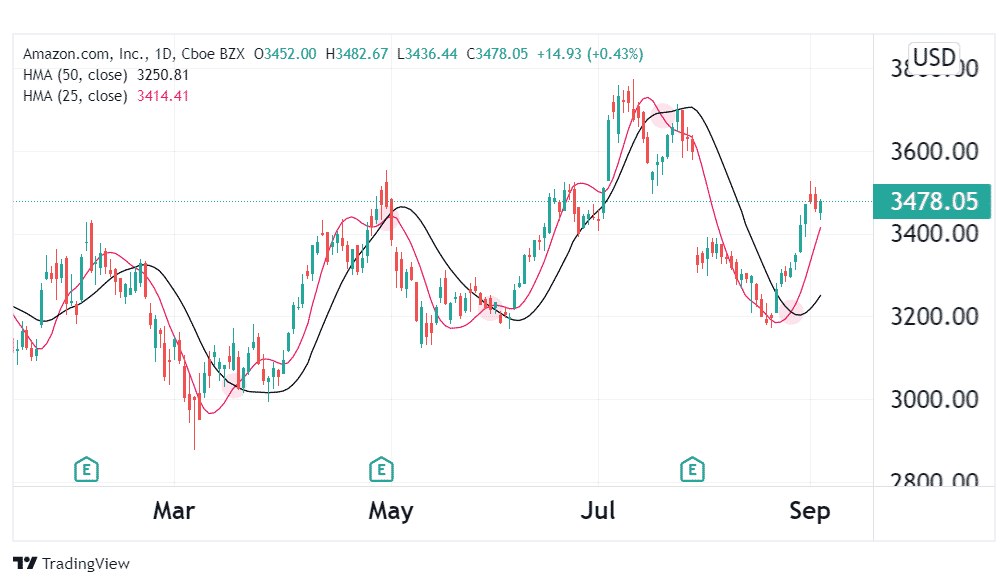
Recommended HMA settings:
- HMA 1- 50 period.
- HMA 2- 25 period.
Another common crossover strategy you can employ is using the HMA indicator in combination with another moving average over a similar period. For instance, let’s take a combination of HMA and EMA.
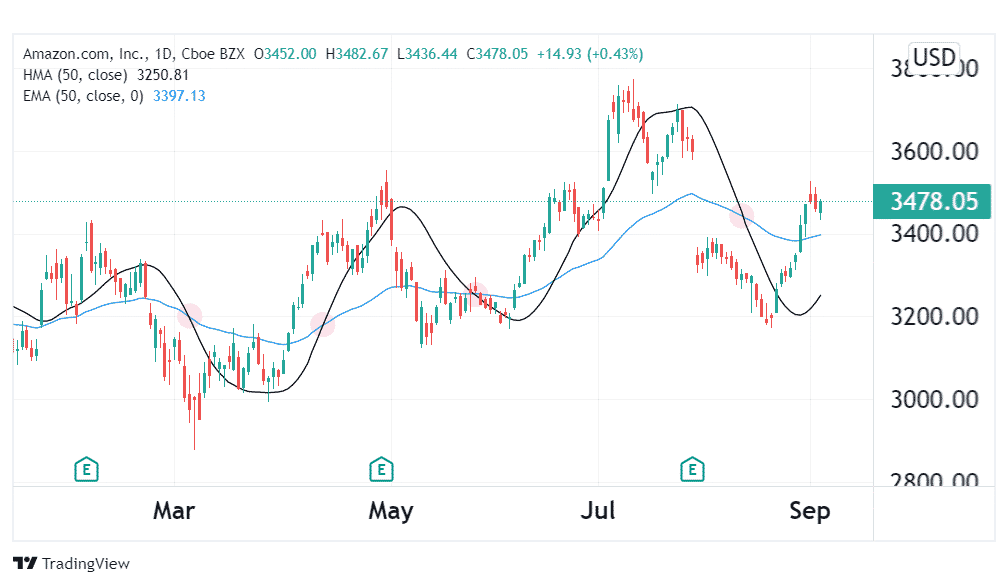
In this daily chart of Amazon stocks, you can see the unreliability of the HMA crossover strategy as not all crossovers correctly predicted a trend reversal. However, a majority of the crossovers preceded an imminent trend change.
Recommended settings:
- HMA- 50 period
- EMA- 50 period
MACD and hull moving average strategy explained
Moving average convergence divergence (MACD) is an indicator that compares two moving averages to highlight trends in the market. To improve accuracy, the HMA indicator is used with the MACD to generate buy and sell signals.
Recommended settings:
- HMA – 50 period
- MACD -12 period EMA, 26 period EMA, 9 period EMA.
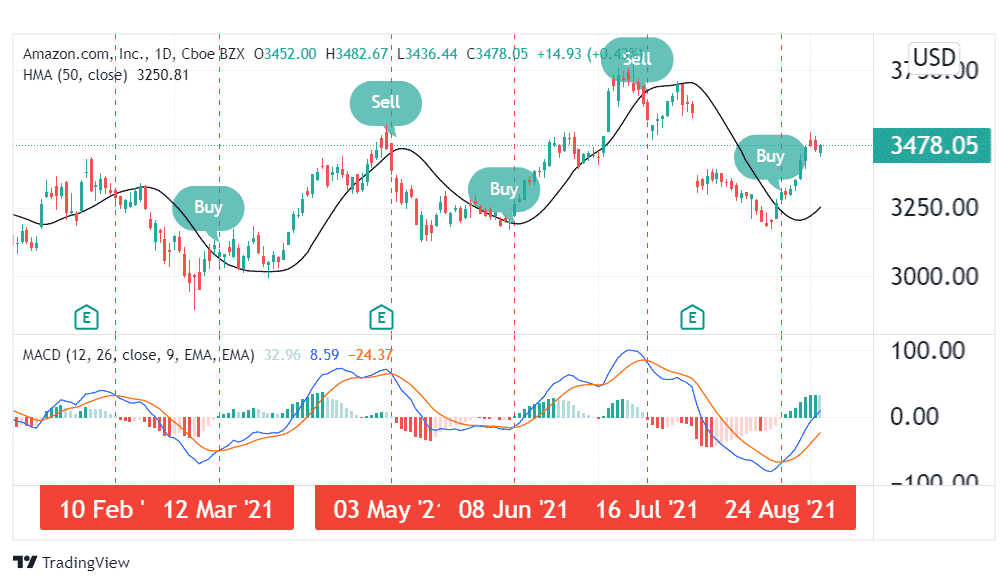
In the above daily chart of Amazon stocks, whenever the blue MACD line crosses above the red signal line, it generates a buy signal. For confirmation, prices should have crossed the HMA line and the stock should be trading above this line.
On the other hand, when the MACD line crosses below the signal line, that’s the signal to go short. When prices cross below the HMA, it serves as confirmation of the sell signal.
RSI and Hull moving average strategy
Relative strength index (RSI) is a useful indicator in determining the strength and direction of price momentum. An RSI above 70 signifies overbought conditions while a score of below 30 signifies oversold conditions. Moreover, a divergence between its slope and the price movement’s slope signifies an imminent trend change.
The recommended settings when using these indicators are:
- HMA- 50 period.
- RSI- 14 period
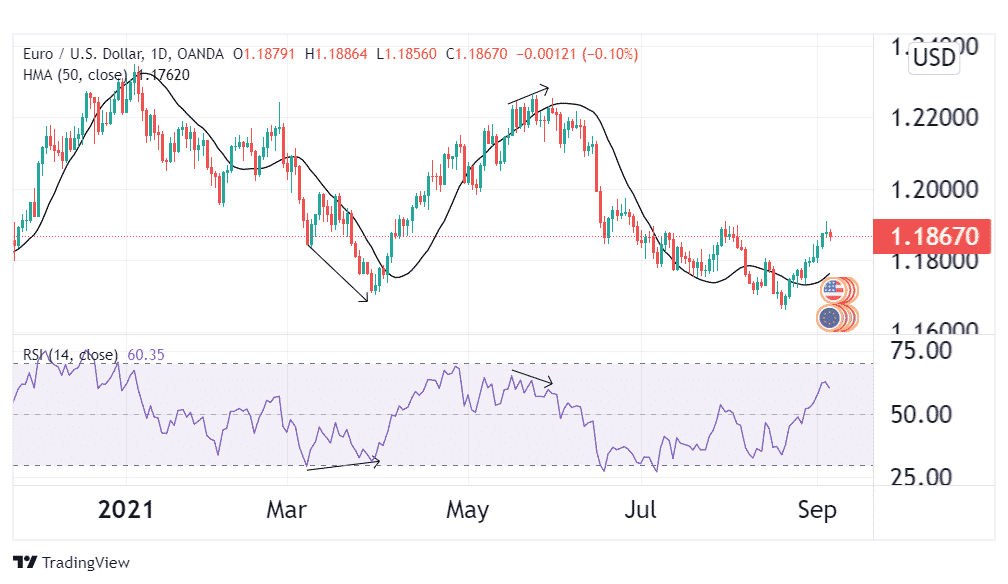
The above example is a EUR/USD chart, on which March saw the pair’s price record lower lows, yet the RSI was trending upwards. This divergence signified a forthcoming trend reversal, which was confirmed when prices crossed above the HMA line. This is a confirmed buy signal.
Later in May, during the subsequent bullish run, the RSI started trending downwards while the prices still seemed to rally. This divergence gave a bearish signal, which was confirmed when prices crossed below the HMA line. This would have been the signal to exit the trade.
How hull moving average and weighted moving average work together in stocks
As we already know, HMA can be used with another moving average of similar length to signify trend reversals. The recommended settings for this setup are:
- HMA- 50 period
- WMA- 50 period
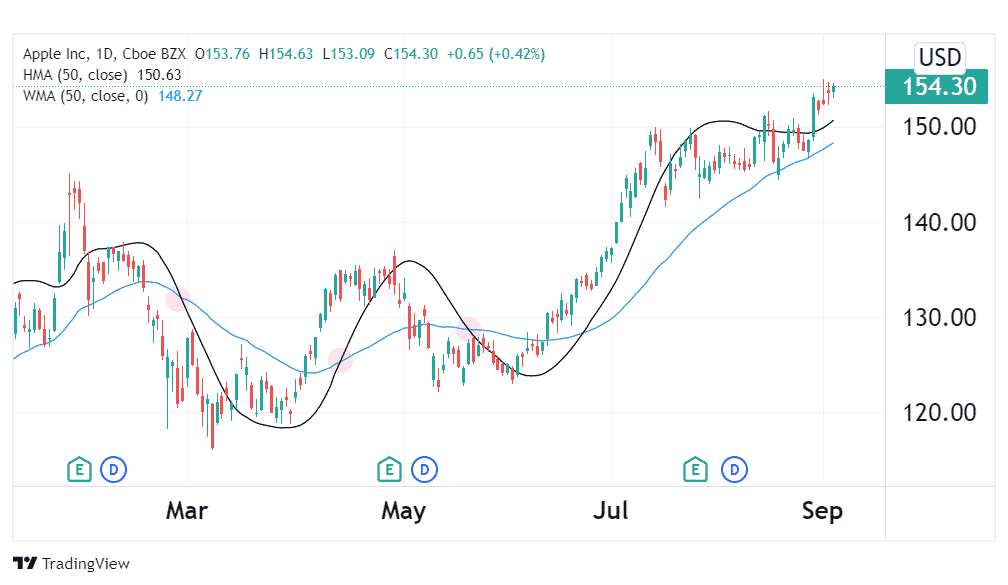
In the example above, the daily chart for Apple shows highlighted HMA and WMA crossovers that correctly predicted forthcoming trend changes. From the right, the first crossover predicted an incoming bullish pattern, the second a bearish pattern emerging while the third correctly foretold the bullish run that followed. After a crossover, once the price crosses the Hull moving average, the trend reversal has begun and one can place their trades at this point.
Conclusion
The Hull moving average indicator is superior in price following and curve smoothness than other moving averages. Therefore, it generates trend reversal signals much earlier than its fellow moving averages. To improve its accuracy in generating entry and exit signals, it is often paired with other indicators such as the MACD, RSI, WMA, or other moving averages.
