Indicators are a useful tool in financial markets that help traders make trade decisions, manage the position, and provide signals.
Throughout development in technology, tons of market utilities have been introduced to its participants. Thousands of available indicators nowadays are a product of this growth, where selecting the best one can be a tedious task.
You should choose the right equipment with a tested background and positive review for your profits to grow. Our article will cover one of the famous indicators that have stood the test of time in performance and results.
Benefits and demerits of indicators
Indicators have the following benefits for traders:
- Management. Indicators help manage your trades by determining the correct entry and exit point.
- Trading signals. A combination of indicators can provide trading signals with a fair amount of accuracy.
- Psychology. Unlike humans, indicators are free of psychological influences.
- Leading. Leading indicators are super helpful in predicting the future of market prices.
Whereas the demerits are:
- Fraud. Indicators that come with a promise of getting rich quickly expose novices and even amateurs to fraud and risk that they possess.
- Lagging. Lagging indicators are those that show the movement based on past prices. These tools are sometimes not useful at all as there is no prediction of future trends.
What is a stochastic indicator?
The stochastic indicator was developed in the 1950s by George Lane and works as a tool for indicating the momentum of prices in the charts through support and resistance levels. It is a range-bound indicator with its value fluctuating between 100 and 0. A number above 80 means that the market is overbought and it’s time to sell, while a point below 20 represents an oversold condition.
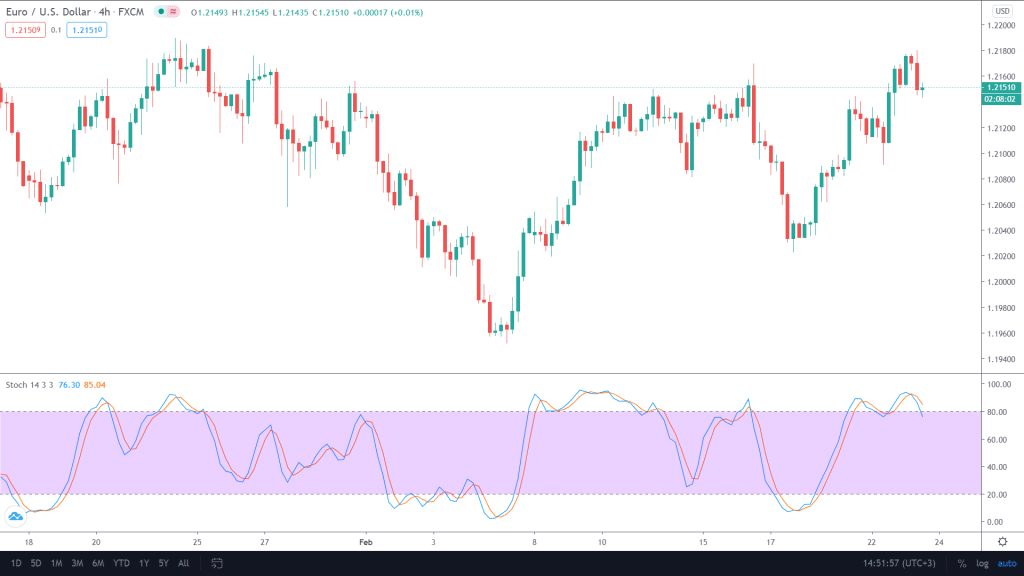
Image 1. You can see the stochastic indicator on the 4HR EUR/USD chart. The indicator continually moves up and down according to market conditions. The orange line shows the three-day moving average, and the blue represents the oscillator’s actual value.
The stochastic indicator is one of the favorite tools of technical traders who utilize chart patterns and price action.
Using Stochastic
You can use stochastic for the following purposes in your trading.
Overbought and oversold conditions
As mentioned before, the stochastic indicator is one of the perfect tools to realize overbought and oversold conditions. Let us take a look at an image where it correctly indicates one of the scenarios.
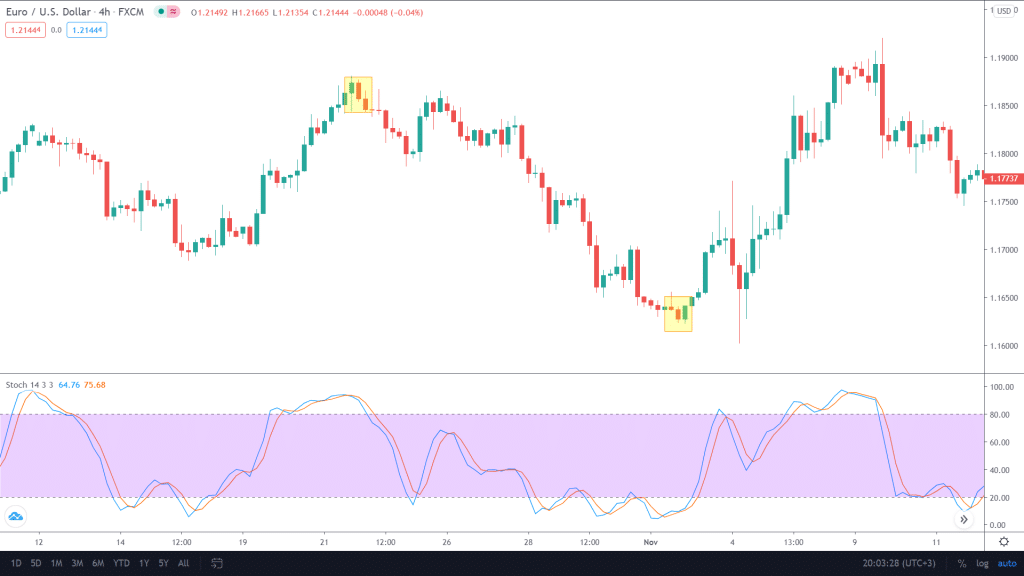
Image 2. Notice the two yellow squares. At one point, the indicator yells overbought, and the market falls and vice versa.
Momentum
Just as a stochastic indicator measures overbought and oversold conditions, one can also use it for determining the momentum of markets by looking at the direction in which the lines are heading. If the blue line is above the red line, the price favors an uptrend and vice versa.
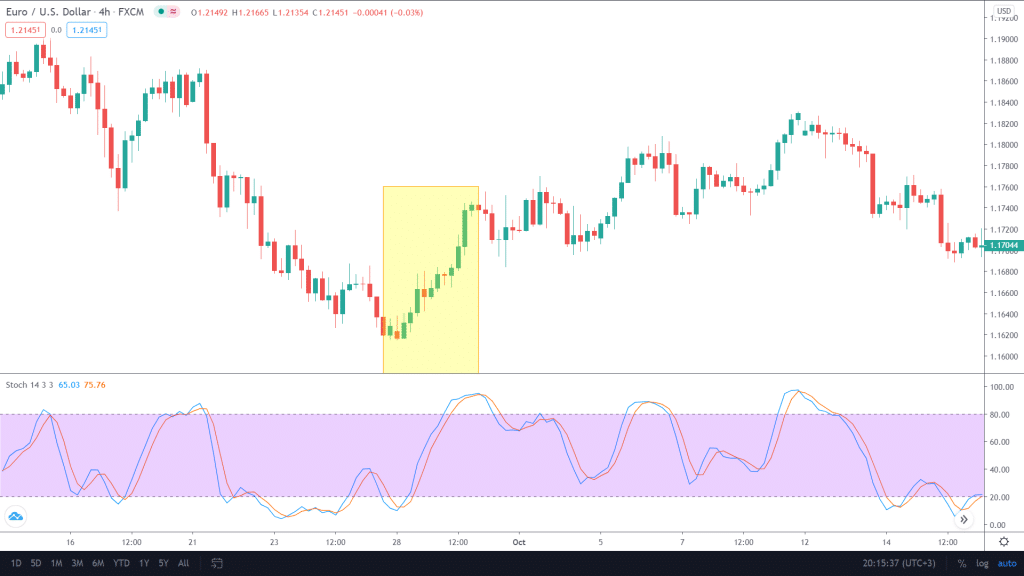
Image 3: The yellow portion highlights the slight uptrend which follows the indicator lines.
Notice that we are talking about probabilities here. There might be conditions when the market does not agree with your analysis.
Reversals
Traders who try and capitalize reversals can find stochastic super beneficial. The concept here is also simple: the cross-over of blue over the red from the bottom will indicate an end to the current downtrend and vice versa. To catch these opportunities at their best, make sure the intersection happens above 80 and below 20.
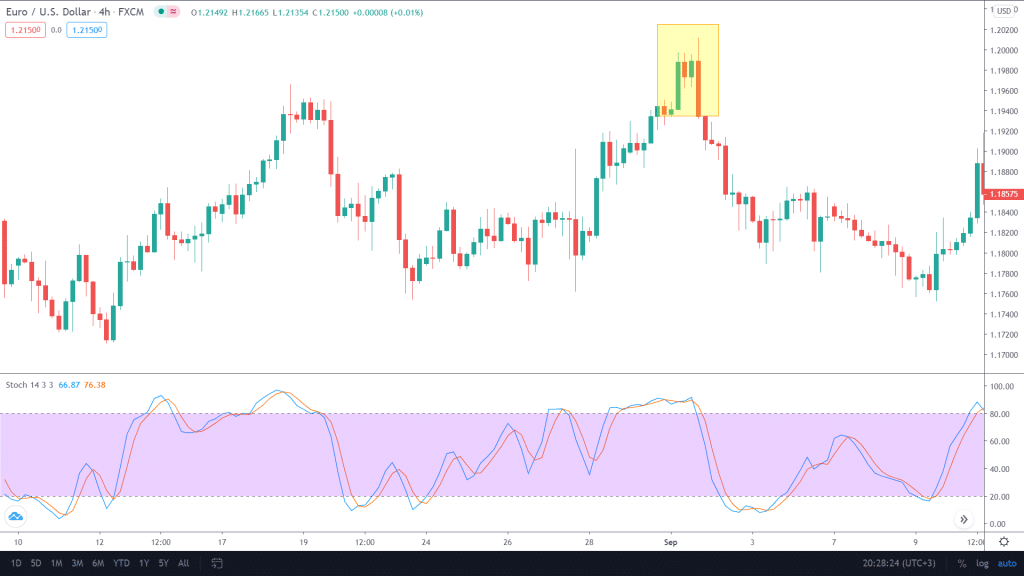
Image 4. A cross-over results in finishing the prior uptrend of the market.
Stochastic indicator strategies
Stochastic provides various good risk-reward and high probability strategies if coupled with other indicators. Trying to find out the best combinations may prove time-consuming, so investors recommend beginners to try one already constructed.
Price action
As mentioned before, price action traders love using technical indicators. They use support and resistance, trend, key levels, Fibs, and candlestick patterns alongside stochastic.
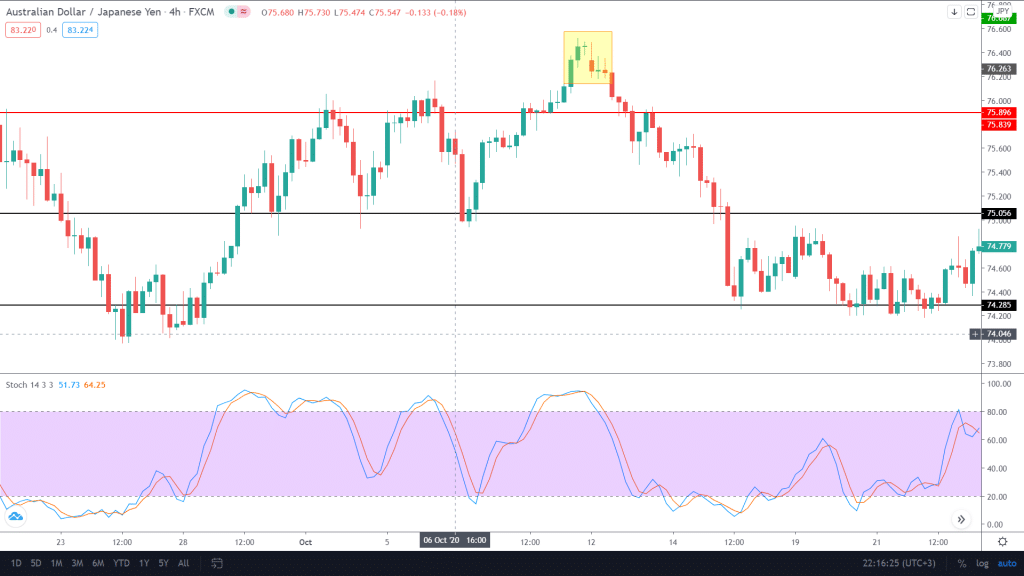
Image 5. A technical trader uses price action to identify daily key levels that are marked in red. As soon as the price reaches the area, he looks out for confirmation from stochastic to a potential short position.
Stochastic and RSI
Open up short positions when both RSI and stochastic are in an overbought condition. The opposite holds for opening a long trade.
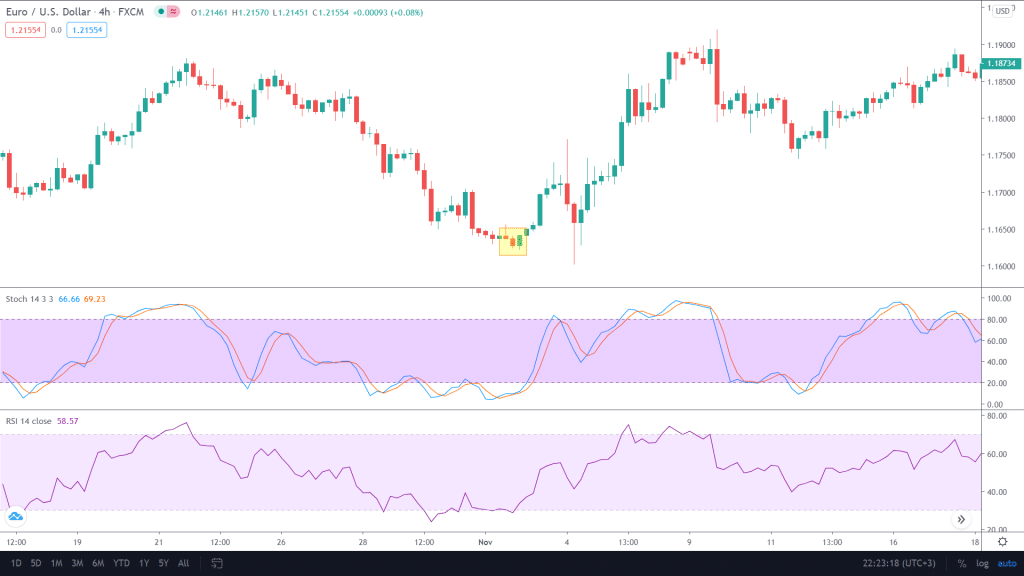
Image 6: The RSI indicator shows extremely oversold conditions and has a good setup for a trader who would like to go long. You can place the stop loss at a margin of 20 or 30 pips according to risk appetite.
Stochastic and moving averages
You can use this strategy on the daily chart as there are fewer chances of fluctuations in prices that may take you out. Employ 2 and 4 exponential moving averages and identify overbought and oversold conditions from stochastic. Enter a buy when 2 EMA crosses 4 EMA from the bottom and vice versa.
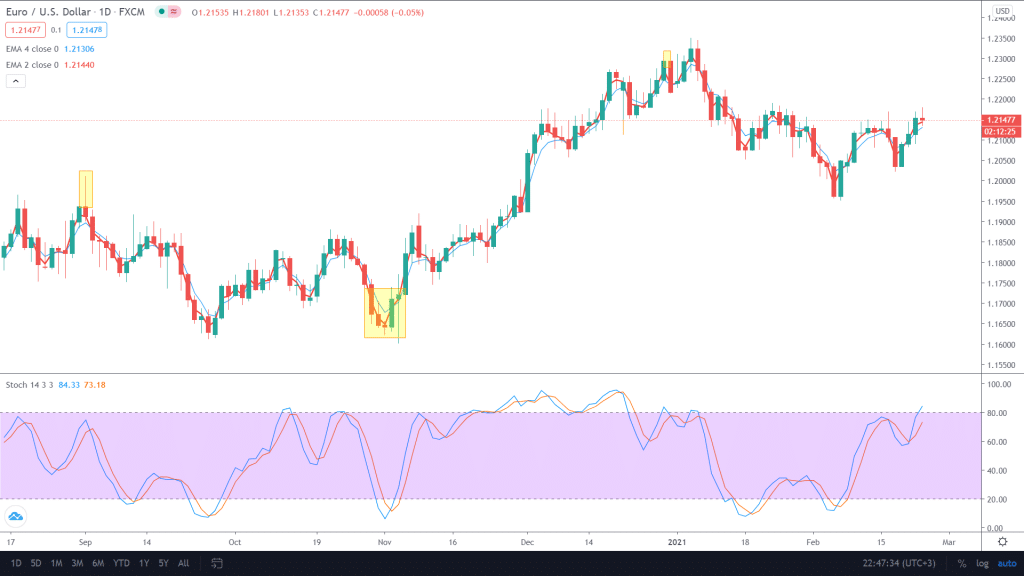
Image 7: The red color represents the 2 EMA while the blue marks the 4EMA. We spot oversold conditions on the stochastic indicator and clarify our long position by the cross-over in moving averages.
End of the line
The stochastic indicator is indeed one of the best tools to compliment your trading. Remember that these kinds of things only work if you put in some effort. You can have the top tools, equipment, and strategy but fail if you ignore risk management and psychology. The market itself presents many opportunities each day, and only those bags in profits are sound and consistent.

