Right after it seemed that the market had lost its steam and headed into an abyss, the new buyers stepped in and supported the prices of the risk assets lifting stock indices and most of the risk currencies at the end of the last week.
The positive US economic data released on Tuesday likely contributed to the revival in the risk sentiment. Unemployment claims fell more than expected, and the quarterly GDP showed a positive surprise (4.3% actual vs. 4.1% exp.).
US President Joe Biden’s comments also added to the market optimism as he doubled the vaccine target to 200 million within the first 100 days of his presidency. According to the President, some economists project the US GDP growth of 6% this year.
DXY – the risk sentiment is showing up
DXY was mixed at the end of the week. While the rebound in risk assets started on Thursday, the Dollar Index continued growing on that day. However, traditionally, the USD is under pressure when stocks and risk currencies catch a bid.
Such a USD behavior may suggest that it has relative strength and may even take the risk currency’s role. If the safe-haven behaves in the opposite way, how much vigor the classic risk assets would have?
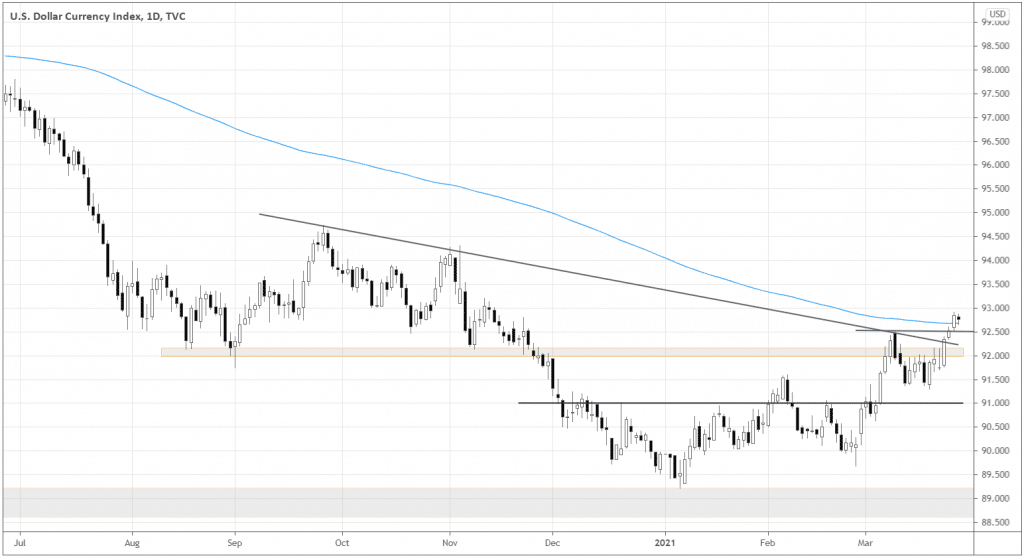
As shown in the illustration above, the DXY got above all key local levels, eventually closing the week above the 200-day Moving Average. It’s easy to imagine the USD going to 94.00-94.5 in the short-term from here.
JPY – the real safe-haven
What should we consider a safe-heaven then if the USD grows along with risk assets? Where do we park our bearish bias?
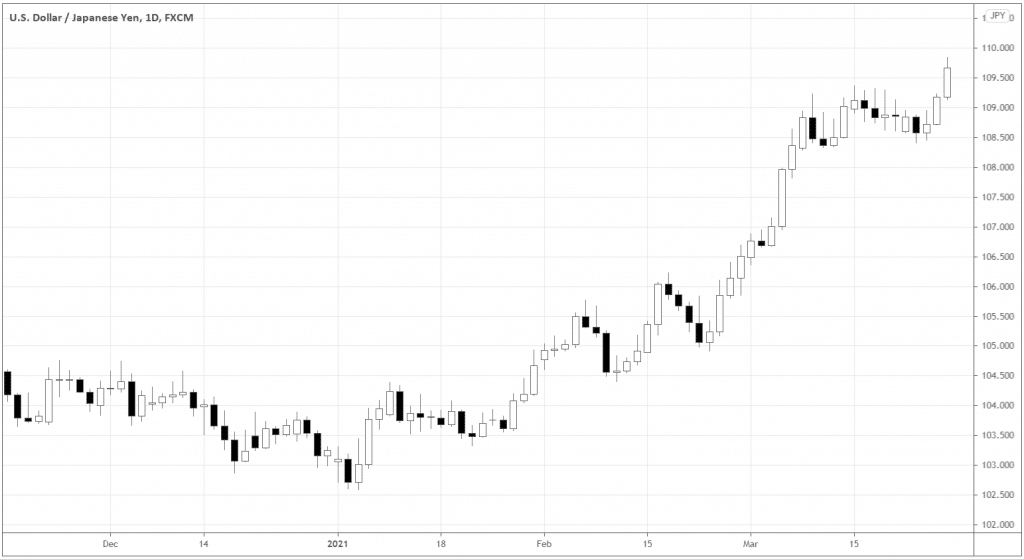
Look at the USDJPY below. The JPY was noticeably weak against the USD in the second part of the last week.
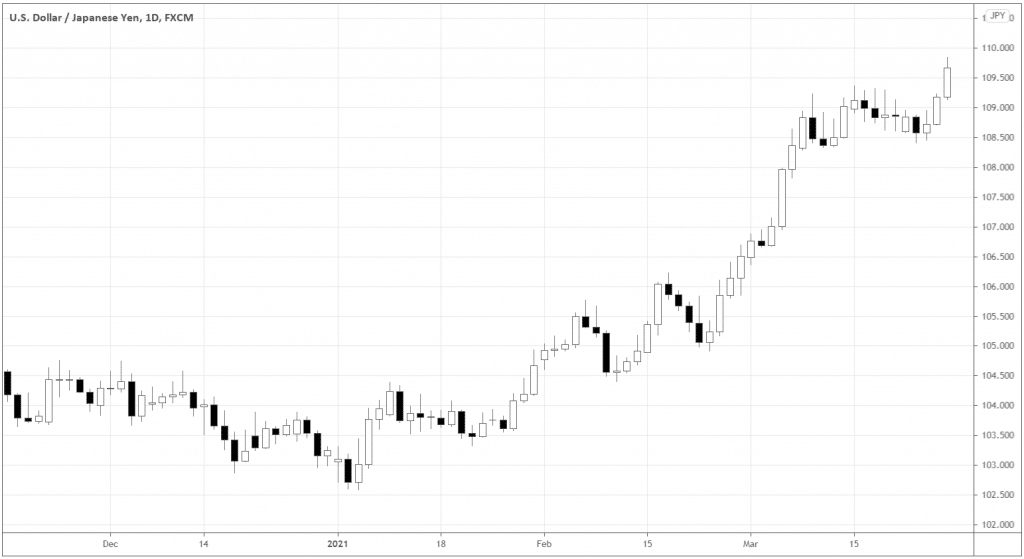
USDJPY has been in the clear uptrend since the beginning of the year, and it keeps making fresh highs. When the risk assets surge, JPY is likely to be one of the best options to open longs against.
If we look at the bigger picture of USDJPY, it gets clearer that the massive breakout of the symmetrical triangle may be due for the pair as the week closed around 109.67 – above the pattern’s upper boundary.
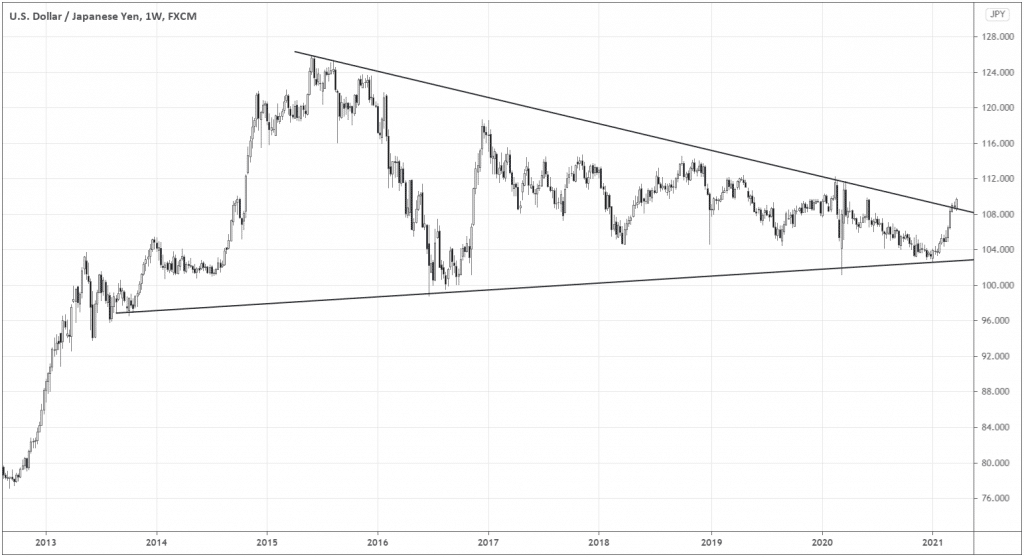
If the breakout is successful, the pair has enormous room to the upside. The breakout may start the new cycle of the yen’s relative weakness and the growth of the risk assets worldwide.
How JPY devaluation may fuel the Nikkei225 bullish market
Weak local currency often boosts the country’s exports, contributing to economic expansion and stock market growth. If the JPY bearish market is due, it makes sense to look into Nikkei225 and anticipate potential buy opportunities.
Below is the monthly chart of Nikkei225. At the end of 2020, the market broke above the long-term range’s upper boundary around 22000 and is currently trending up.
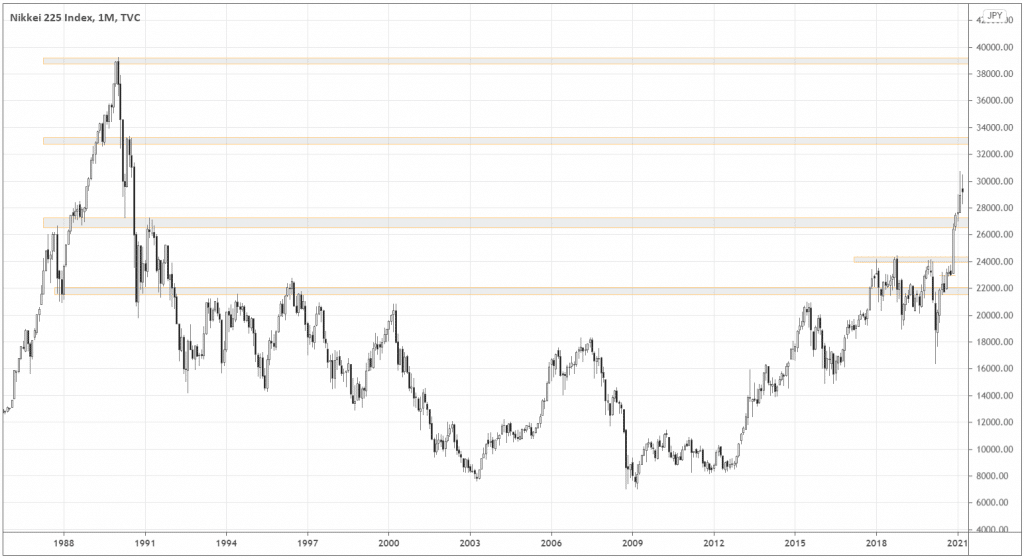
The next possible targets are likely at 33000 and 39000.
Japanese economy went through tectonic changes since the market crashed in 1990. Thanks to corporate governance reform, monetary easing, fiscal stimulus, and structural reforms, the Japanese market is more competitive as shareholders have stronger incentives regarding companies’ profitability.
The weakness of JPY can drive the economic growth of Japan, especially considering that Consumer Discretionary, one of the most export-oriented sectors of Nikkei 225, has the most significant weighting of the index totaling 21.81%.
On the weekly chart above, we can see the correlation with USDJPY is getting direct again (see the red indicator window), signaling that further depreciation of JPY may push Nikkei225 higher.
Long-term traders may already consider long positions with stop-losses below 28000, and short-term traders may buy at the breakout of the bullish flag pattern keeping protective stops below the breakout week’s low.
Conclusion
The recent US economic data and Joe Biden’s comments support risk assets and the USD. JPY may be at the beginning of the long-term downtrend, propelling Nikkei 225 higher.
