
You can be deadly wrong in most of the things you do as a trader and still make money. I’m saying that not to convince you that trading is easy – it’s absolutely not.
However, think of those who simply decided to “buy and hold” during the dot com bubble or the bullish commodities market in the 1970s. As long as the market is directional and resilient, it’s a no-brainer what to do. Other things are just technicalities.
Let’s see what markets can offer us in such a favorable environment and, conversely, what we should stay away from.
Dollar index
Let’s look at what’s happening with the Dollar index, getting a general picture of the global risk sentiment. The Daily DXY chart below is in a downtrend, although the index has been showing some signs of strength recently.

The 91.00 key level seems to be a turning point regarding short-term bias. As long as the market is above 91.00, we can expect some pressure on the risk assets. I’d only consider a reversal in DXY if it holds above the 200-day Moving Average. Any attempts to get back below 91.00 should fuel further growth in risk assets.
S&P 500 and NASDAQ are out of favor?
Traders that prefer the US market should stay cautious. The two most popular US indices seem to consistently lose steam, although still in an uptrend.
Below are S&P 500 and NASDAQ 100 indices. The RSI indicator shows the divergence in momentum (inclined black line) from the beginning of 2021 for the S&P 500 and from December 2020 for the NASDAQ 100.

For futures and CFD traders, it may mean poorer risk-to-reward potential for the long trades and more frequent whipsaws.
The US market doesn’t end with the two indices above. The Dow Jones index or US Wall St. 30 index (CFD) shows a different picture in terms of momentum.

The price action already looks compelling – the market recovered above 32000 after the recent pullback and kept making new all-time-highs since then. The RSI shows that momentum is consistent as the tops of the indicator’s swings are at the same level.
For those seeking equities exposure in the non-US developed markets, DAX can be a great option. Look how RSI shows the drastic change in momentum as the indicator ramped up above the trendline.

The index didn’t do much for three years and now has broken out and is making new all-time-highs. Something definitely changed!
What drives indices: sector intricacies
Indices include groups of stocks, and those stocks belong to different sectors. Different indices vary by the sectors’ weight in them. Depending on the performance of certain sectors, indices would react in a certain way as sectors would have an impact on the indices according to the sectors’ weight in each.
Here is the table of the relevant Sector Weightings for the indices we looked at before. The purpose of NASDAQ 100 is to track techs, so it’s obvious what sector impacts the index the most.
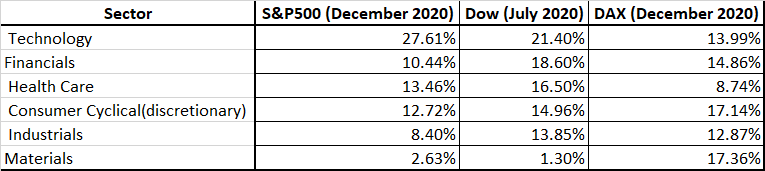
Notice how big the presence of the tech sector is in S&P 500 and how much more balanced in terms of weightings are other indices.
Now let’s look at the recent performance of the relevant US sectors that are represented by their respective ETFs in the chart below.
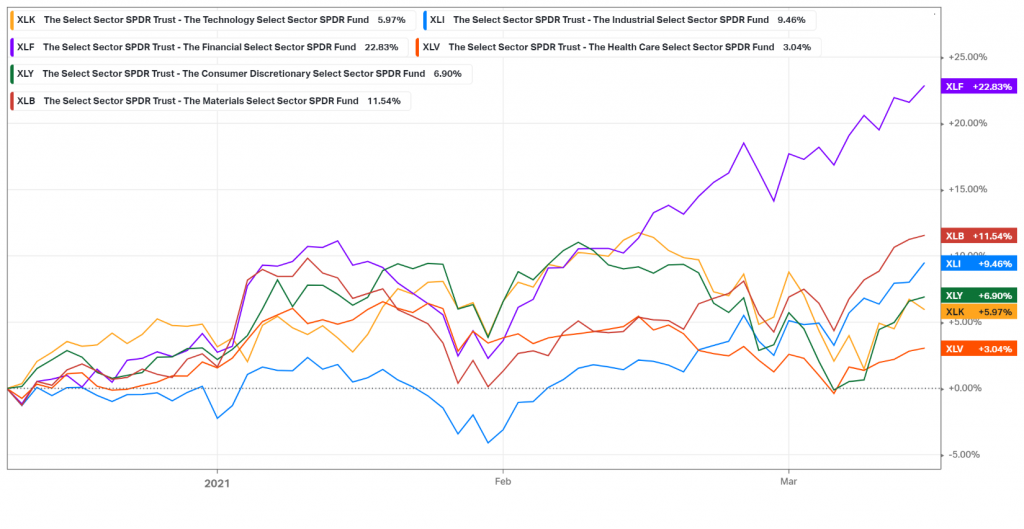
Technology (XLK) is the most underperforming sector after healthcare. No wonder S&P 500 and NASDAQ 100 are so sluggish as they’re dragged down by techs!
On the contrary, Financials (XLF) lead the way, more than three times outperforming Technology. The weight of Financials is higher in Dow and Dax, so the growth of the sector propels the indices up. The weight of Materials (XLB) is the highest in DAX, and look at that XLB performance! You get the idea.
Conclusion
Traders should pursue strong trends as the odds of profits are higher. US Wall St. 30 Index and DAX are the new leaders in terms of relative strength. The strength is fueled by the outperformance of the sectors that have a higher weighting in the indices.


