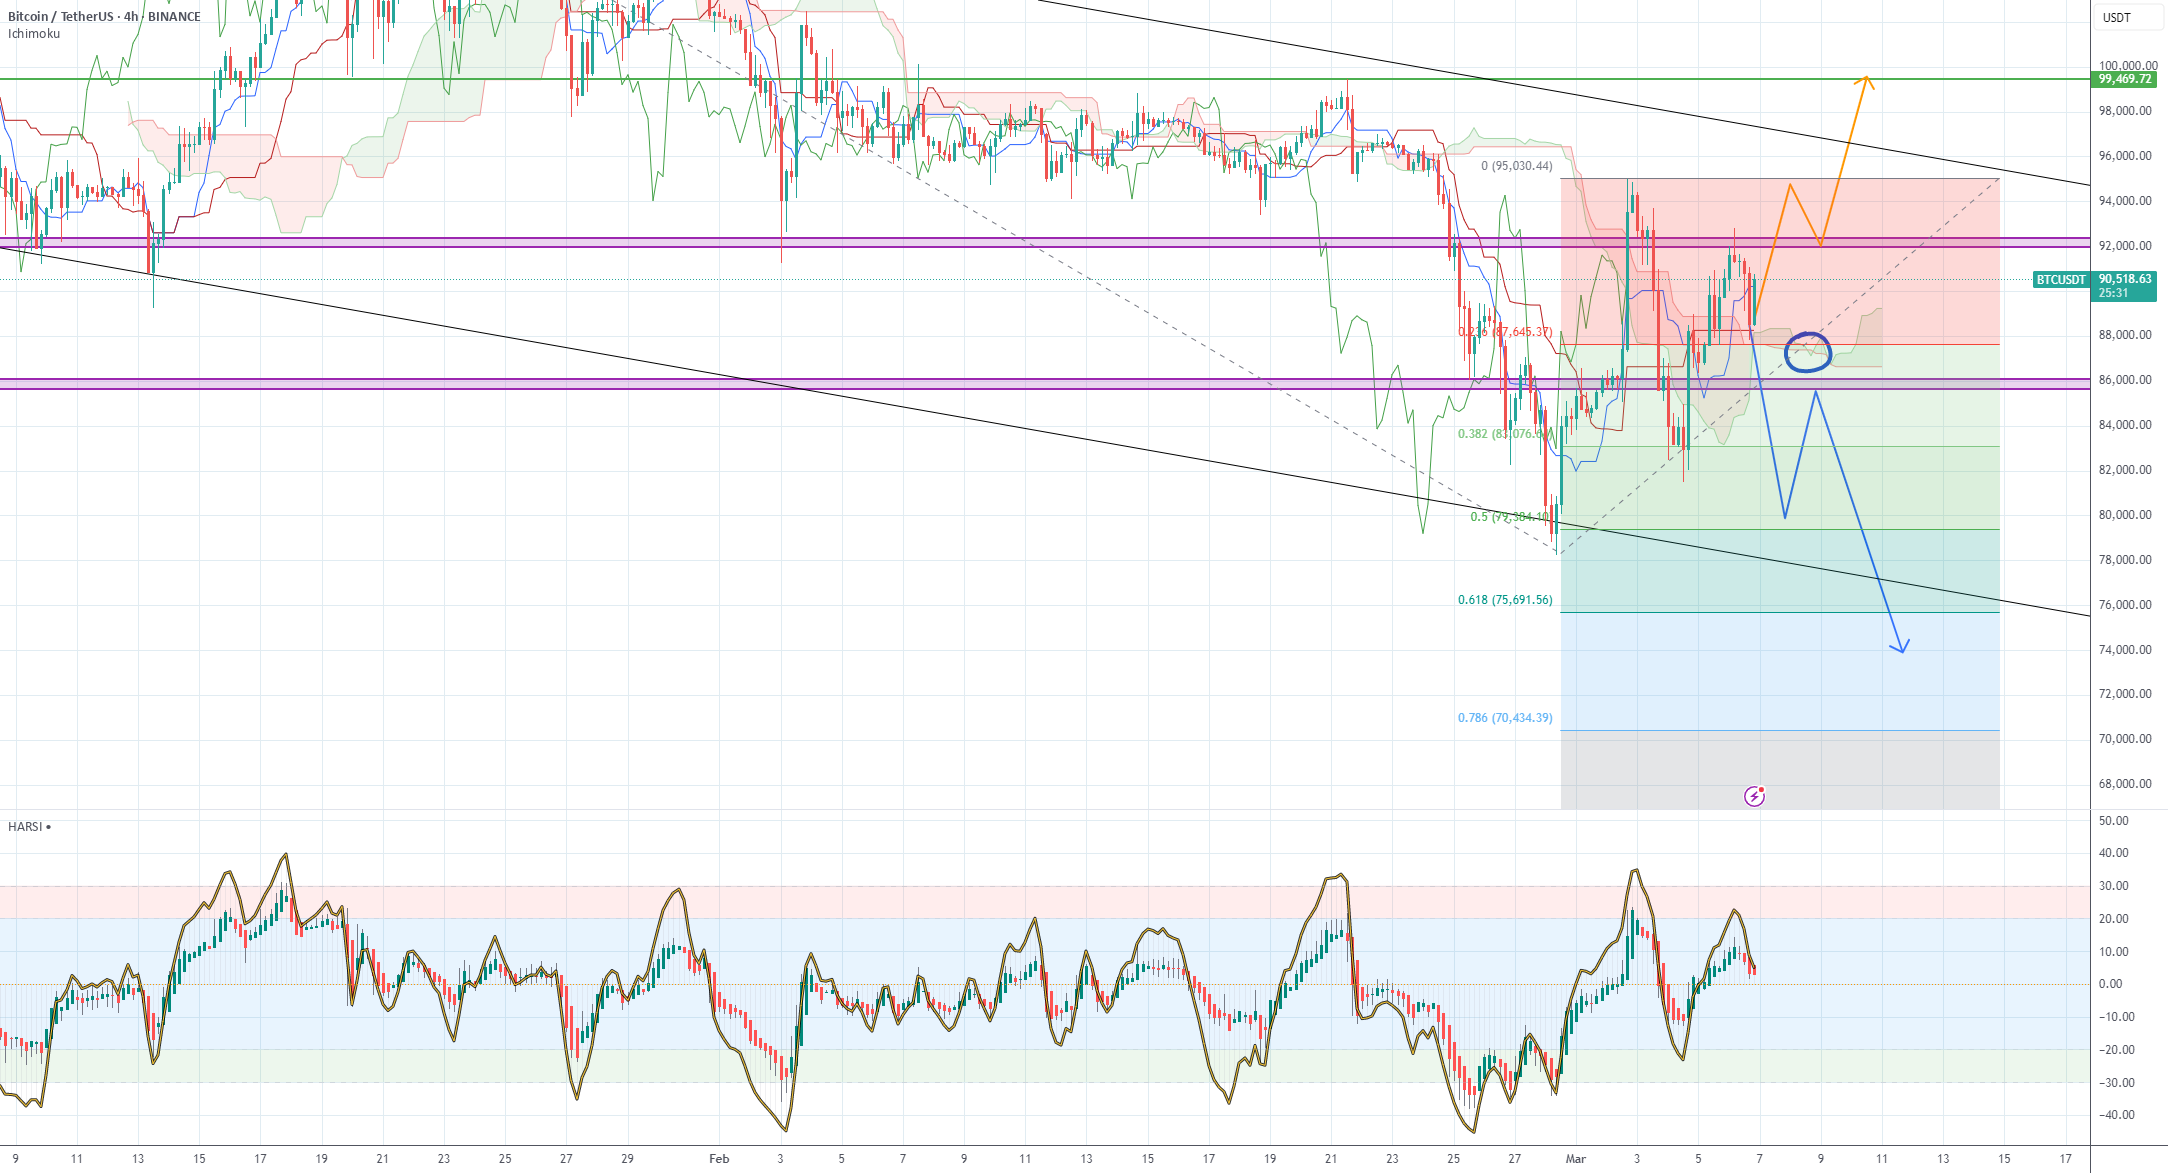
🎯 Key Support and Resistance Levels
Resistance Zone: $100,000 is identified as a key resistance level.
Support Zone: The $83,500-$86,000 range is a strong support area where the price recently showed a reaction.
Additional Critical Levels: If the support fails, $76,000 and $72,000 could serve as potential re-entry points.
📊 Ichimoku Indicator & Technical Signals
The price is currently inside the Ichimoku cloud, indicating a highly volatile and uncertain zone.
If the price stabilizes above the cloud, further upward movement is possible.
However, failure to hold above the cloud increases the likelihood of a deeper correction toward support levels.
📈 RSI (HARSI) Analysis
The indicator has recently been in the overbought zone and is undergoing a correction.
This correction may lead to a slight pullback, providing a re-entry opportunity.
⚡ Market Structure & Overall Trend
Bitcoin has failed to break its previous high but has been forming higher lows.
Recent candlestick formations indicate increasing selling pressure, suggesting a possible price decline.
Observing higher timeframes is crucial to confirm a continued bearish trend.
🔄 Bitcoin Dominance (BTC.D) Analysis
BTC dominance is fluctuating between 60% and 61%.
It remains above the Ichimoku cloud but has shifted from a strong bullish trend to a neutral state.
A decline in dominance could favor altcoins, while a breakout above 63% might push the market back toward Bitcoin.
📉 Bearish Scenario & Potential Targets
If selling pressure continues and the $86,000 support is broken, a decline toward $76,000 or even $72,000 is likely.
The presence of a liquidity node within the Ichimoku cloud suggests the market may move toward filling that zone.
The $62,000 level has also been identified as a key liquidity area on lower timeframes (4H), which could become a future target.
📈 Bullish Scenario & Trading Opportunities
If the price stabilizes above $92,000, the next targets will be $97,000 and then $100,000.
A strong reaction in the $83,500-$86,000 range could present a potential buy opportunity.
💡 Proposed Strategy
1️⃣ If strong bearish candles form with high volume, consider short positions targeting $76,000 and $72,000.
2️⃣ If a bullish reaction is observed near $83,500-$86,000, look for a buying opportunity.
3️⃣ Stay updated on fundamental news, as new liquidity inflows could shift the trend.
📌 Final Conclusion
Bitcoin is currently at a critical juncture. If it fails to break key resistance levels, a deeper correction may follow. However, if liquidity enters the market and price stabilizes above key zones, a renewed uptrend is possible. The final decision depends on how the price reacts at these crucial levels. Always practice proper risk management and set stop-losses accordingly. 🚀


