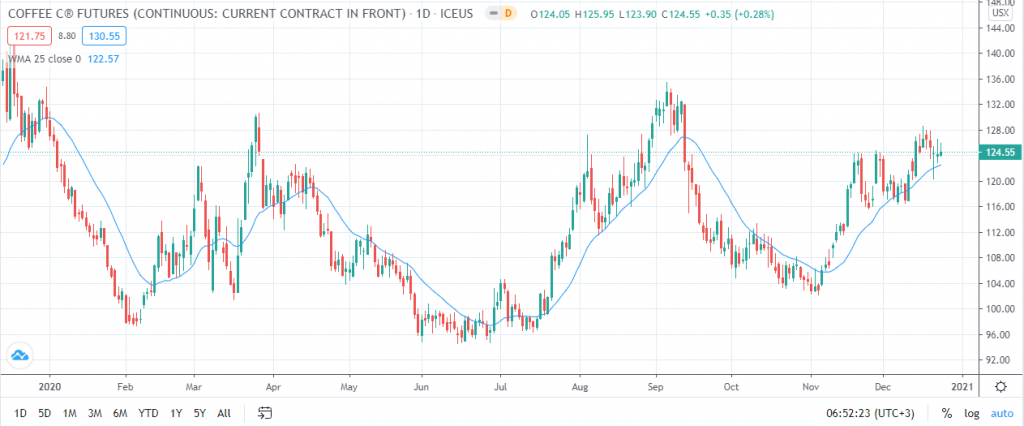
The weighted moving average (WMA) is a technical indicator that shows the direction of an asset’s price. Just like the other moving averages, it enables traders to generate trade signals. Its uniqueness as a moving average is in its emphasis on the most recent data points. This means that the current price will have a higher weight than the previous ones.
How to calculate the weighted moving average
To calculate the WMA, one needs to assign a weighting to each of the recent data points. The most recent data point should have a higher weighting than the preceding ones. In total, the weights should be 1 or 100%.
The formula may sound confusing, so let’s look at a practical scenario.
Let’s assume that company X’s closing prices over the past three days are $81, $80, and $83 in that order. To calculate the WMA, we will need to assign weights to each price point. Since $83 is the most recent closing price, it will have the highest weight of 3. Day 1 ($81) and day 2 ($80) will have a weight of 1 and 2, respectively.
Next, multiply each of the prices with its weighting factor before finding the total. In this case, it will be ($81*1) + ($80*2) + ($83*3) = 490.
Divide this total by the sum of the weighting factors. The sum of the assigned weightings is 1 + 2 + 3 = 6. So, for the three days, the WMA will be 490/6 = $81.67.
As aforementioned, the assigned weights should add up to 1. The total of the weightings, in this case, is 6—subsequently, 6/6=1.
How to use WMA in trading
Just like the other moving averages, the WMA line is helpful in identifying the direction of an asset’s price. When the price appears below the WMA, that’s a sign that the security is set to trade higher than during the analyzed period. Similarly, to confirm a downward trend, the asset’s price should appear below the WMA line.
WMA also provides trade signals. Depending on your trading strategy, you can incorporate other technical indicators to identify the best price point to enter or exit a trade. For instance, one can open a buy position close to the WMA when the prices are on an uptrend.
WMA is also useful in measuring price movement. This is because the moving average is sensitive to changes in a security’s price. However, this also means that it may not smooth out erratic prices as it is highly impacted by volatility.
Furthermore, just like the other moving averages, traders can use the WMA to identify support and resistance levels. A rising WMA indicates support. Similarly, a falling one will help you identify the resistance level.
Example of WMA

The image above is a daily coffee chart, with the blue line denoting the WMA. As seen, the commodity’s price is above the WMA line. This is a bullish sign indicating that the price is on an upward trend. At the same time, the moving average slope is evening. Subsequently, one can identify the support level at around $124.55.


