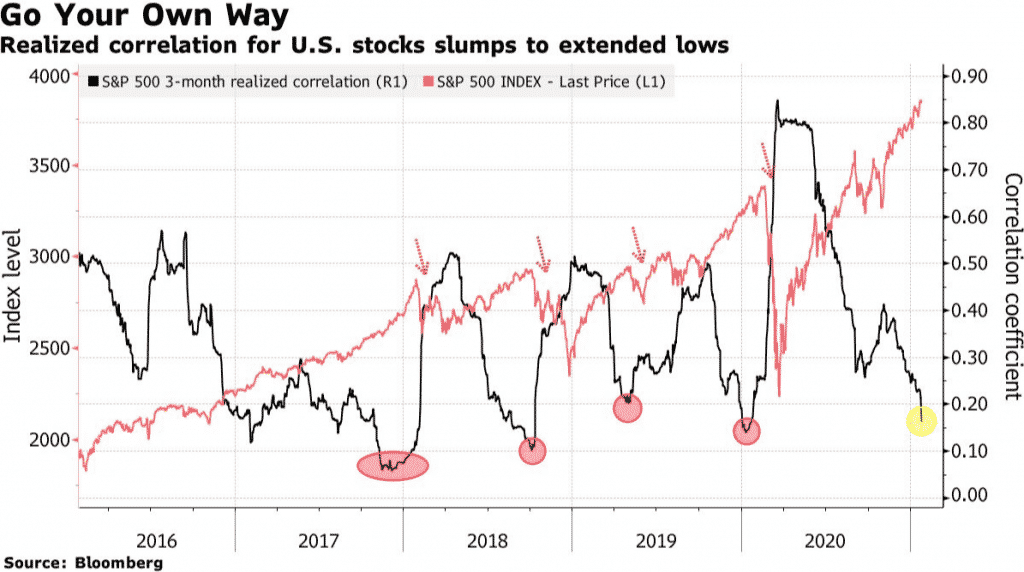
S&P 500 index’s three-month realized correlation has fallen to just 0.16%, its lowest in a year and an extreme level in history, according to Bloomberg. The correlation gauges how closely the top stocks in the benchmark move relative to each other, and a maximum 1.0 level would signify all the shares are moving in lockstep.

- Behind the decline in the correlation of U.S stocks is a combination of the stock rotation seen after the election of President Joe Biden.
- Investors positioned for the likelihood of further stimulus under President Biden and equity moves due to the current earnings season.
- Low correlations are also an indication of weakening market breadth and have previously occurred before recent stock market corrections.
- The S&P correlation index hit a record low of 0.06 in December 2017, a month before the “Volmageddon” correction in U.S. equities began in January.
- The S&P correlation fell again to 0.10 in October 2018, paving the way for an end-of-year slump in U.S stocks.
- Fund managers welcome low correlations as they look to beat indexes through stock picking since if most equities are moving in the same direction, it becomes difficult to choose one that stands out.
U.S. stocks are currently gaining. S&P 500 is up 0.066%


