Definition of a golden cross
The golden cross is a technical indicator that occurs when a short-term moving average (MA) crosses over a long-term one on the upside. Traders use it as a signal of a potential bull market. Depending on one’s trading strategy, the indicator is applicable with different sets of simple or exponential moving averages. For instance, a trader may decide to use 15 and 50-day moving averages as the short and long-term MAs respectively. Those relying on a daily or weekly trading chart may choose to use lengthier timeframes like a set of 50 and 200-day moving averages.
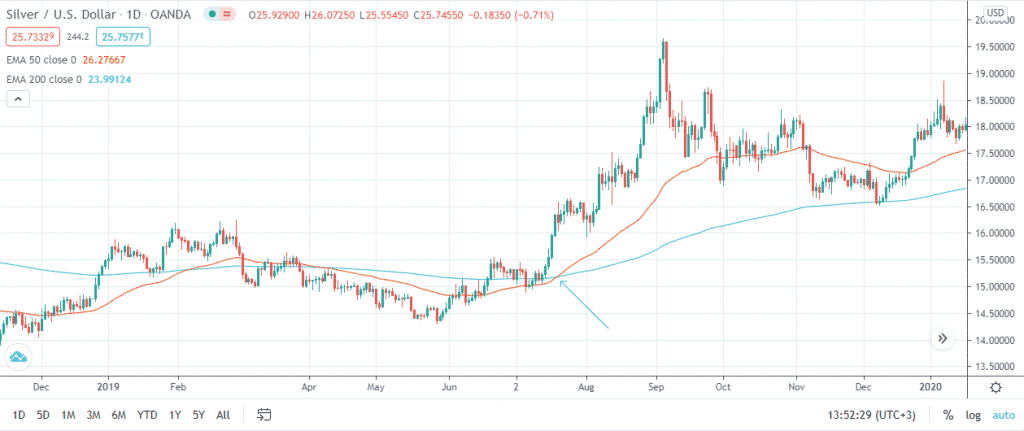
In a typical chart, the golden cross would appear as shown below. The arrow represents the crossover. However, due to the lagging nature of the indicator, the crossover occurs when the downtrend is already over, and the uptrend is on course.

Stages of a golden cross
The golden cross has three distinct stages. To begin with, the existing downtrend appears to be coming to an end. This is usually triggered by the rising buying interest and the subsequent drop in the interest to sell. At this point, the short-term moving average is usually below the long-term one.
Next, an uptrend emerges. The new trend is marked by the short-term moving average crossing the long-term one to the upper side. This is what is referred to as the golden cross.
The final stage acts as confirmation of the bullish trend. During this phase, the uptrend continues. The short and long-term moving averages should provide support to the asset prices in the event of a corrective downward retracement. Provided the price and the short-term moving average remains above the long-term one, the bull market is bound to continue.
How to trade with the golden cross
The golden cross is one of the tools that a trader can use to identify the points at which he/she should enter or exit a trade. Besides, including it in your technical analysis will help in deciding on whether to buy and hold an asset or sell it.
For the traders who are looking to short sell a financial instrument, the golden cross can act as a sign that the downtrend has come to an end. As such, the trader should exit their current position to avoid incurring hefty losses.
Furthermore, for those looking to buy an asset while incorporating this indicator into their technical analysis, the best point to enter the market is when the prices are above the long-term moving average. This approach is more efficient than waiting for the short-term moving average to cross over. The reasoning behind this tactic is that the golden cross is more of a lagging than a leading indicator. This means that the crossover may occur when the downtrend has already ended, and the bullish market has taken over.
To confirm the trend in the event of a golden cross, traders often use complementary momentum indicators like the relative strength index (RSI). This is because, unlike the lagging nature of the golden cross, the RSI is one of the leading indicators. As such, it acts as an apt solution to the golden cross’ predisposition of lagging behind the actual price action.
Limitation of the golden cross
Just like the other indicators, the golden cross is not perfect in predicting price movements. While it is helpful in identifying a looming bull market, one should use other indicators and signals to confirm the analysis. Besides, it is important to use the principle of the risk-reward ratio to avoid risking large amounts of money for insignificant returns. Risk management parameters like stop loss and take profit are also useful in trading the golden cross.


