A bull trap refers to the reversal of a bullish trend that forces the bulls in the market to exit their long positions and incur hefty losses. It is a trap because the traders are usually caught unaware.
What causes a bull trap?
A bull trap often occurs after a downtrend seems to have ended. As the gradient lessens, traders position themselves to benefit from the ride back up. However, some big money traders take advantage of this scenario. They set a bull trap by buying significant amounts of the asset to artificially push the prices higher. It is a tactic to fool the other traders that the downtrend has ended, hence initiating a false bull market.
The trap gets investors to buy the financial instrument based on their prediction that prices will continue rising. The initial buyers push the prices past certain levels – an aspect that entices more gullible traders to open long positions. Once the asset’s price surges significantly, the initiators of the trap sell it. The result is a sharp downward momentum that forces those in a long position to exit their trades. The selling pressure causes the price to decline even further.
Signs of a looming bull trap
- Prices testing a certain resistance level severely
One of the ways to identify a probable bull trap is when a security’s price reacts significantly to a particular resistance level after an uptrend. When this pattern repeats itself more than twice, it may mean that the bulls are putting in their all but are fearful of the resistance zone. Subsequently, the prices are likely to pull back and form a bull trap.
- Formation of a range at the resistance level
The range pattern occurs when the asset’s prices bounce within the support and resistance zones. With the bull trap, the large bullish candlestick will form and close outside the range on the upside.
- Significantly large bullish candlestick
Prior to the prices crashing, there is usually a huge bullish candlestick that appears on the chart. This can be interpreted in one of two ways. To start with, new buyers may see it as a breakout on the upside, hence, overwhelmed to buy the asset. It may also signify that big money traders are deliberately fuelling the rally as a way to lure naïve buyers into the bull trap.
Classic chart patterns of a bull trap
As a trader, you can identify a bull trap if you know what to look out for. In technical analysis, there are certain candlestick patterns that will alert you of a possible bull trap. This includes:
Rejected double-top pattern
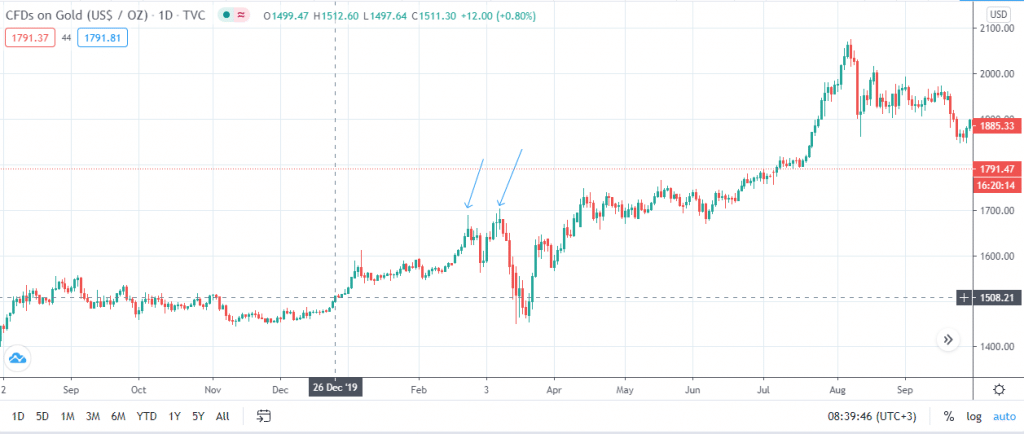
The usual double-top candlestick pattern is a bearish setup. In the case of a rejected double-top, the second candlestick has an extended upper wick as a signal of the significant rejection of the higher prices. The image below is the gold price daily chart. The two arrows show the two tops. As a typical characteristic of the bearish pattern, the wick of the candlestick at the second top is extended. What follows is the asset’s price downtrend?

Failed re-test
A looming bull trap can also be observed when the asset price breaks out on the upside, trying to test the resistance level, but fails and heads downwards. On the one hand, experienced traders often wait for the second attempt of the price to breach the resistance/support level as a trend confirmation. However, novice traders may interpret the breakout as the start of a bullish trend, only for the prices to crash abruptly.


