What are Bollinger Bands?
Bollinger Bands are a technical indicator used to measure the level of volatility in a market. It is also helpful in identifying if an asset is in the oversold or overbought territories. Bollinger Bands appear as three lines; the upper band, middle line, and lower band. The middle line represents the simple moving average. On the other hand, the lower and upper bands signify the standard deviations.
Notably, the spacing between the bands highlights price variations. When the market is rather quiet, the bands will be close together. However, under volatile conditions, the bands will be further apart. When using Bollinger Bands to form a viable trading strategy, the Bollinger bounce and squeeze are crucial aspects.
Bollinger bounce
This term is founded on the fact that an asset’s price ultimately returns to the mid-section of the Bollinger Bands. This is because the bands act as support and resistance levels. Traders often use the Bollinger bounce strategy when the prices are within a particular range rather than when there is an observable trend.
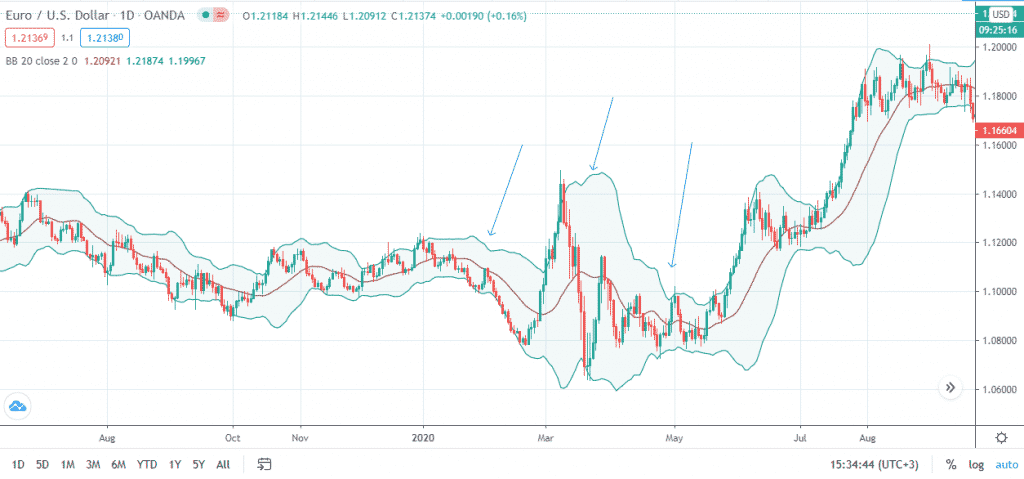
In the EUR/USD daily chart below, the arrows show the different phases of the band movement. In the initial phase, the currency pair is largely trading at the middle section of the Bollinger Bands. The bands then expand as the volatility in the market heightens. As aforementioned, prices always return to the mid-section. This is observable in the first phase as the bands narrow towards the middle.

Bollinger squeeze
When the bands get close to each other, it is often a sign of a looming breakout. In some instances, the trader will look out for a candle breaking out of the upper band to signal an uptrend. Similarly, if the candle breaks out below the lower band, that is a sign that the prices will continue with the downtrend. Subsequently, one is able to make a trading decision while the trend is still at the initial stages. However, it is important to note that this strategy is not applicable in all setups.
Advantages and limitations of Bollinger Bands
Advantages
One of the benefits of using Bollinger Bands is its function as an indicator of a market trend. As the bands narrow or widen, a trader is able to observe if an asset’s price is on a strong uptrend or downtrend. Subsequently, it becomes easy to identify the level of volatility in the market and act accordingly.
Furthermore, it is possible to plot the Bollinger Bands automatically on your trading platform. This makes it a user-friendly indicator, especially for the novice traders. Regardless of your level of experience in the trading world, the indicator will help you view a price chart in a different way. As a result, one is able to make a sound decision on a particular trade.
Limitations
As one of its limitations, Bollinger Bands are more reactive than predictive. They follow the existing price movements. This means that a trader may receive a signal when the price trend has already formed. Besides, it is important to note that the indicator is not fool-proof. To conduct a detailed and reliable technical analysis, it helps to combine the Bollinger Bands with other indicators.


