What a crazy week it’s been! During the Election week, the US Dollar made the ride from the upper boundary of the three months’ sideways channel all the way to the down border, crashing any expectations of mine about USD recovery (see the chart of DXY below).
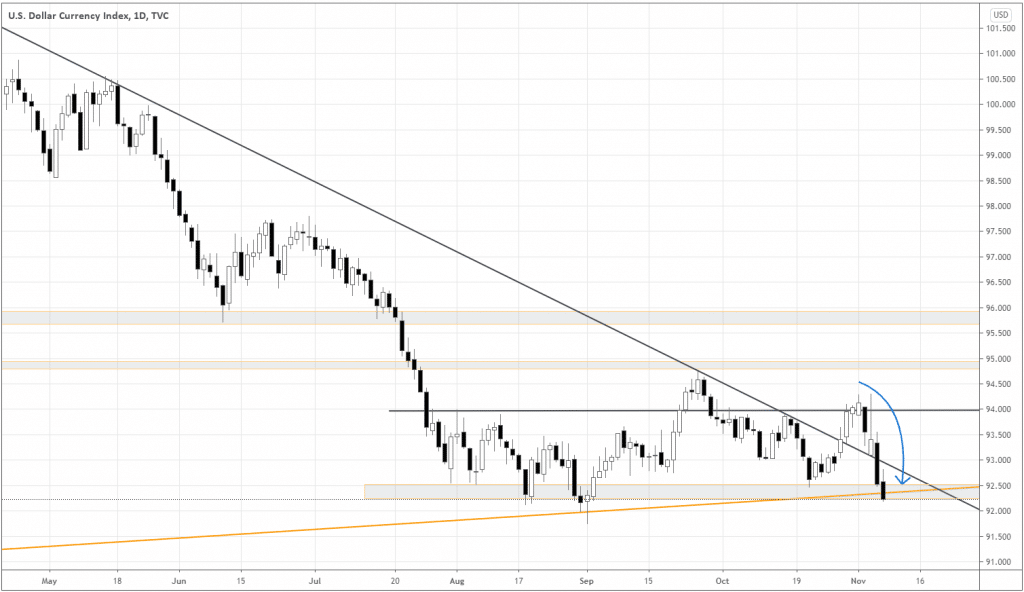
We can see that DXY failed again to hold above 94.00 and the long-term trendline (see the inclined black trendline on the chart). On Friday, DXY even managed to close below the long-term trendline (inclined orange trendline) of the uptrend that’s been around since 2011! That’s a decisive step towards the sentiment of the risk-seeking!
Democrats, led by the newly elected president Joe Biden, can push through their stimulus bill, surpassing the two trillion-dollar mark. No wonder the US Dollar plummeted on the expectations of the upcoming supply, as Republicans have less power to lower the amount of economic aid after the election.
Although the range hasn’t been broken yet, it would be reasonable to prepare for the bullish trend in risk assets. The confirmation of the beginning of such a trend would be a confident breakdown (big black candle) of the September low around 91.75.
Another cycle of risk-taking – what is different?
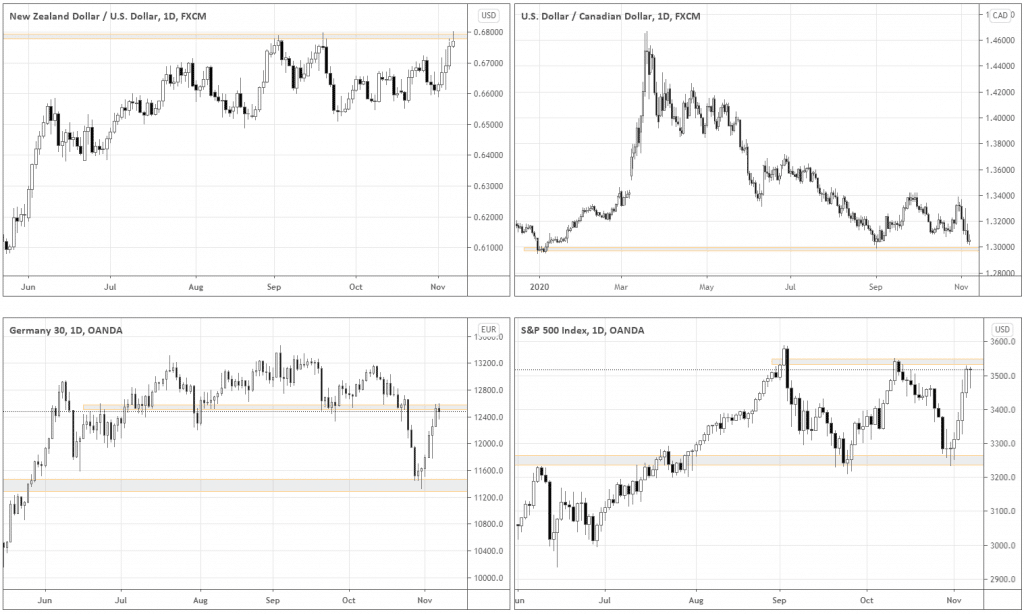
Many of the risk assets are currently at the crossroads, as they’re testing their respective supports or resistances (See the charts of NZDUSD, USDCAD, DAX, and S&P 500 below).
However, this time there is something fundamentally different between the safe heavens – USD and JPY. Look at the weekly chart of USDJPY below. Do you see anything suspicious?
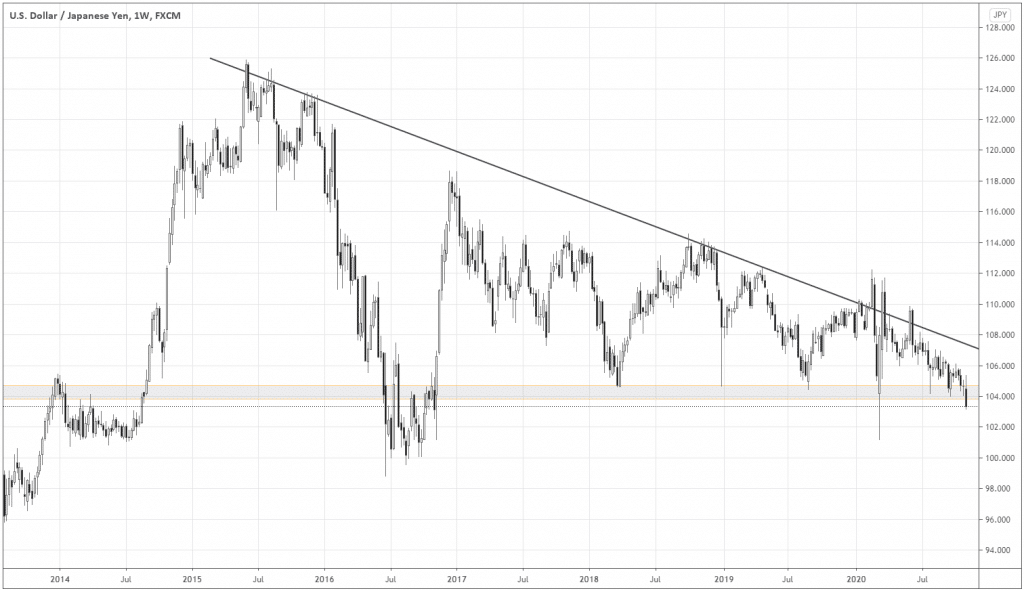
Look at this epic descending triangle that’s been forming since 2015! The grey support area and the inclined trendline form this massive pattern.
The last candle is the result of the US Election week volatility. What could be a better time for the breakout? If this is indeed a real breakout, we’re at the beginning of the bearish trend of the US dollar. The breakout happened before the new highs in stocks, which affirms the relative weakness of the Greenback.
What do we do about it?
It makes sense to short USDJPY with a stop above the breakdown candle’s high (short horizontal black line). The minimum target should be March low. This trade would have a Risk/Reward ratio of around 2:1, with at least a 50% hit rate.
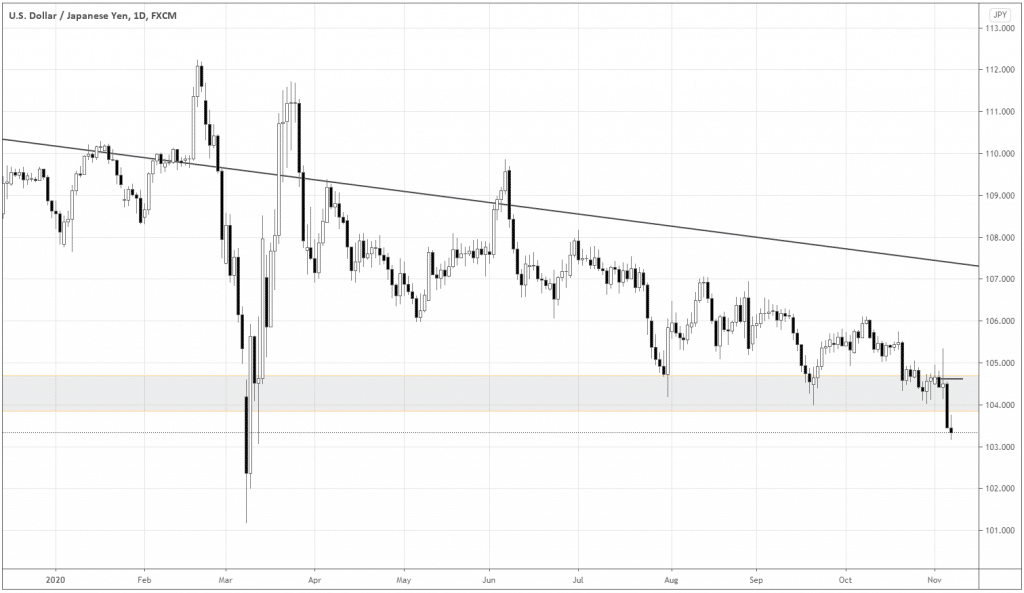
What I particularly like about this setup is the resilience to the global sentiment changes. If the sentiment turns into risk-aversion, any short positions in USD against other risk assets may retrace and go for our stops easier. However, if we short USDJPY, even if the US Dollar starts retracing globally, it shouldn’t push the USDJPY higher much as long as the pair is in the down-momentum mode, caused by the long-term descending triangle breakout.
As USDJPY gains momentum, USD would become a relatively weak safe-haven, compared to JPY. So, during the risk-seeking cycle, it would be great to buy risk assets against the USD.
Summing up
As the US Dollar and global risk assets are at the crossroads, we may be witnessing the beginning of the bearish trend in USD. The long-term descending triangle in USDJPY offers a low-risk opportunity to profit from a breakout trade. As USD is likely becoming a relatively weak safe-haven, it would be a good idea to short it against other risk assets.
