Hello, traders.
If you “Follow”, you can always get new information quickly.
Please click “Boost” as well.
Have a nice day today.
————————————-
We need to check the movement after a new candle is created.
USDT, USDC should gap up to know that funds have flowed into the coin market.
On the other hand, if there is a gap down, I think funds have flowed out of the coin market.
Therefore, I think USDT or USDC are showing the size and flow of funds in the coin market.
–
(BTC.D 1M chart)
If BTC dominance is maintained above 62.47 or continues to rise, altcoins are likely to show a large decline.
Therefore, in order for an altcoin bull market to begin, it must fall below 55.01 and remain there or continue to decline.
–
(USDT.D 1M chart)
USDT is a fund that has a large influence on the coin market.
Therefore, if USDT dominance rises, it means that the coin market is likely to show an overall decline.
On the other hand, if it falls, it can be interpreted that the coin market is likely to show an overall rise.
In order for the coin market to start an upward trend, it must fall below 4.97 and remain there or continue to decline.
In particular, if the Fibonacci ratio rises above 0.618, the coin market is likely to plummet.
If it remains above the Fibonacci ratio of 0.618, it is likely to rise to around 7.14.
——————————————-
(NAS100USD 12M chart)
It has currently entered the most important support and resistance zone.
–
(1W chart)
Therefore, the maximum decline point is expected to be around 14922.2.
In order to continue the uptrend, the price must be maintained above the M-Signal indicator on the 1M chart.
Therefore, the key is whether it can receive support near the most important support and resistance zone and rise above the M-Signal indicator on the 1M chart.
———————————————
(SPX500USD 1W chart)
The key is whether it can be supported around 4773.4-4846.1 and rise above the M-Signal indicator on the 1M chart.
If not, the maximum decline is expected to be around 3875.1-4116.0.
———————————————
(BTCUSDT 1M chart)
As I mentioned before, since the dotted trend line (1) is not acting as a clear trend line, there is a high possibility of volatility.
Therefore, when the StochRSI indicator creates a peak in the oversold zone and rises this time, there is a possibility that a trend will be formed as a trend line between lows is created.
However, the high-point trend line and the low-point trend line must be formed in the same direction.
In other words, since the current high-point trend line is creating an upward trend line, the low-point trend line that will be created this time must also create an upward trend line.
In that sense, the 69000-73199.86 section can be seen as an important support and resistance section.
If it falls below 69000, it is likely to touch the Fibonacci ratio section of 0.886 (56227.18) ~ 1 (61338.93), which was the previous high point section.
–
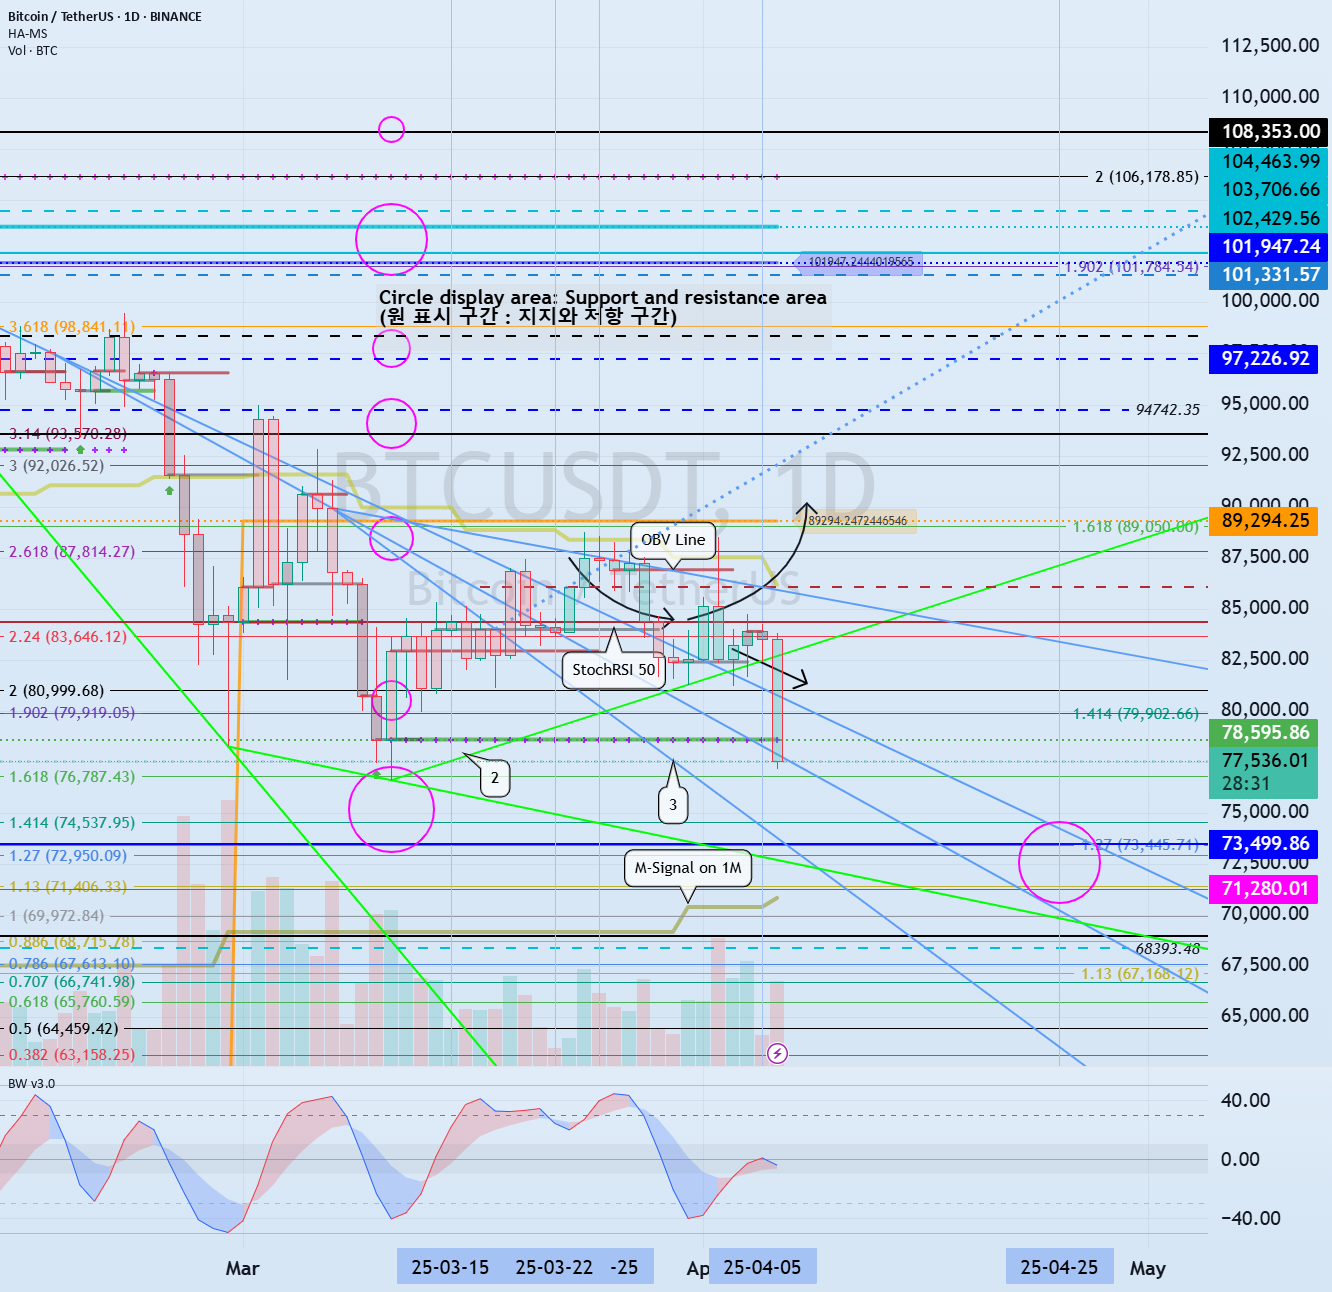
(1D chart)
On the last day of this volatility period, it fell below the upward trend line (2), showing a large decline.
Since it fell below the downward trend line, there is a possibility that it will continue to fall further.
At this time, the key is whether it can rise with support near 73499.86.
The next volatility period is around April 25 (April 24-26).
The point of interest is whether the price is maintained near 73499.86 or 89294.25 after the next volatility period.
–
The 73499.86 point is the HA-High indicator point on the 1M chart.
The M-Signal indicator on the 1M chart is rising to around 73499.86.
Therefore, if support is confirmed near the M-Signal indicator on the 1M chart, I think it is an aggressive buying period.
If it falls below the M-Signal indicator on the 1M chart, it is a buying period until it rises again and supports near the M-Signal indicator on the 1M chart.
The next time to buy is when it shows support near the Fibonacci ratio range of 0.886 (56227.18) ~ 1 (61338.93) that I mentioned in the 1M chart explanation.
–
Thank you for reading to the end.
I hope you have a successful trade.
————————————————–
– This is an explanation of the big picture.
I used TradingView’s INDEX chart to check the entire range of BTC.
I rewrote the previous chart to update it while touching the Fibonacci ratio range of 1.902 (101875.70) ~ 2 (106275.10).
(Previous BTCUSD 12M chart)
Looking at the big picture, it seems to have been maintaining an upward trend following a pattern since 2015.
That is, it is a pattern that maintains a 3-year uptrend and faces a 1-year downtrend.
Accordingly, the uptrend is expected to continue until 2025.
–
(Current BTCUSD 12M chart)
Based on the currently written Fibonacci ratio, it is displayed up to 3.618 (178910.15).
It is expected that it will not fall again below the Fibonacci ratio of 0.618 (44234.54).
(BTCUSDT 12M chart)
Based on the BTCUSDT chart, I think it is around 42283.58.
–
I will explain it again with the BTCUSD chart.
The Fibonacci ratio ranges marked in the green boxes, 1.902 (101875.70) ~ 2 (106275.10) and 3 (151166.97) ~ 3.14 (157451.83), are expected to be important support and resistance ranges.
In other words, it seems likely that they will act as volume profile ranges.
Therefore, in order to break through these ranges upward, I think the point to watch is whether they can receive support and rise near the Fibonacci ratios of 1.618 (89126.41) and 2.618 (134018.28).
Therefore, the maximum rising range in 2025 is expected to be the 3 (151166.97) ~ 3.14 (157451.83) range.
In order to do that, we need to see if it is supported and rises near 2.618 (134018.28).
If it falls after the bull market in 2025, we don’t know how far it will fall, but based on the previous decline, we expect it to fall by about -60% to -70%.
Therefore, if it starts to fall near the Fibonacci ratio 3.14 (157451.83), it seems likely that it will fall to around Fibonacci 0.618 (44234.54).
I will explain more details when the bear market starts.
——————————————————