What is a hanging man candlestick?
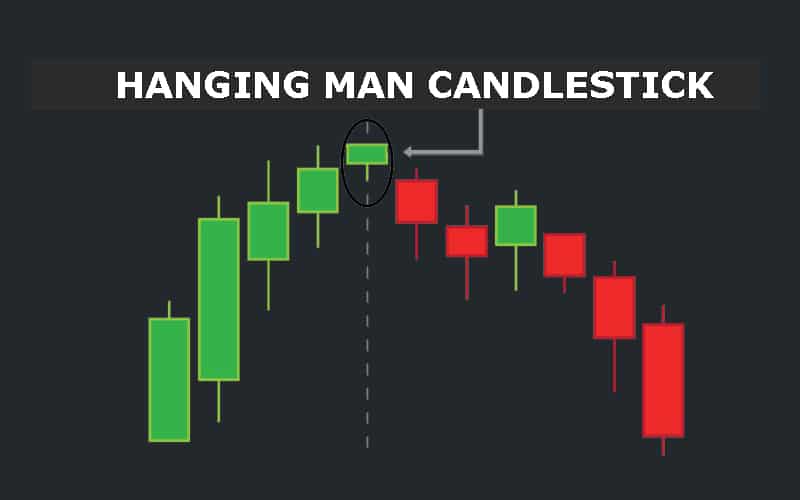
A hanging man candlestick is a candlestick that signifies a bearish reversal pattern. It occurs when an asset is on an uptrend, and acts as a warning to traders that the price trend is likely to shift downwards. Since the candlestick is simply a warning, the next one must indicate a further decline in prices as a confirmation of the bearish reversal.
How to identify a hanging man candlestick
The hanging man candlestick looks somewhat like a “T”. To begin with, it has a little or no upper wick. On the other hand, the lower shadow is usually long; twice as long as the real body. Another distinctive feature is that the real body appears on the upper part of the trade range.
Notably, the colour of the candlestick does not change its status as a bearish signal. When the candle is red, that’s a sign that the price closed lower than its opening price. A green hanging man candle is still bearish. It indicates that the asset’s closing price was higher than the opening price.
How to interpret the hanging man candlestick
This candlestick forms when the asset is on an uptrend. It is a sign that the buyers are losing control of the market. After increased demand and the resultant surge in prices, a sell-off occurs. Buyers are then able to push the prices back up to a level that is close to the opening price. However, the initial sell-off shows that an increasing number of investors believe that the price has reached its peak.
As part of the technical analysis, the formed pattern will offer an opportunity for a trader to close a long position or go short based on the prediction that the prices will move downwards. Usually, the candlestick is helpful in evaluating the short-term changes and momentum of the asset price. As such, even in the presence of the hanging man candle, the long-term trend may remain the same.
Furthermore, the reversal signal generated by the hanging man candlestick should be followed by a confirmation candle on the next day. Since this candlestick denotes a decline in price, the next day should be represented by a bearish candle.
The confirmation can be in one of two forms. The first scenario is the occurrence of a gap. This means that there will be a discontinuity in the chart with the price dropping from the prior day’s close. The discontinuity is because no trading was taking place at that period. Alternatively, the confirmation can appear in the form of the next day’s closing price being lower than that of the hanging man candlestick.
Example of hanging man candlestick

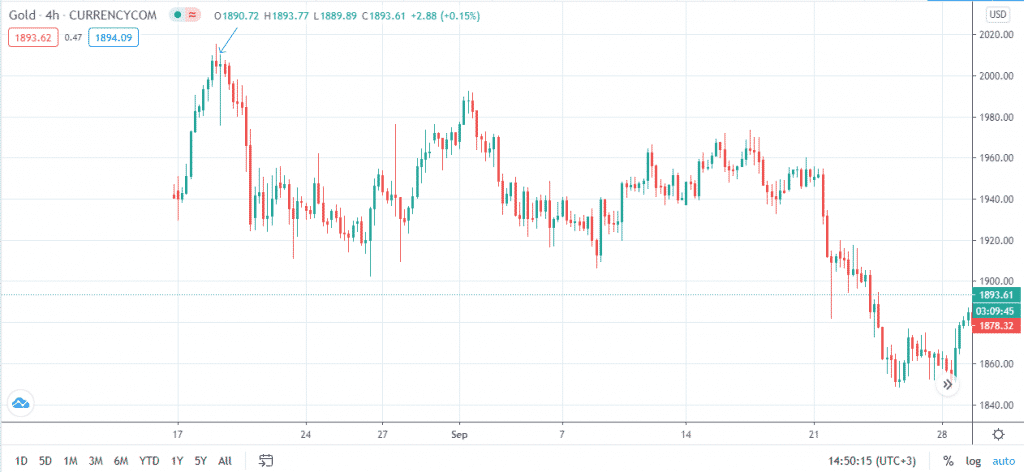
The image above is the 4-hour gold chart, with the arrow pointing to a hanging man candlestick. You will notice that the candlestick has formed while the asset is on an uptrend. The candle’s lower shadow is significantly longer than the real body, with the upper shadow being small. As a confirmation that the candlestick is indeed a hanging man, the next day’s closing price is lower than that of the hanging man. With the candle indicating a bearish reversal, there is a clear shift in the trend as the metal price takes a downward momentum.


