What is a hammer candlestick pattern?
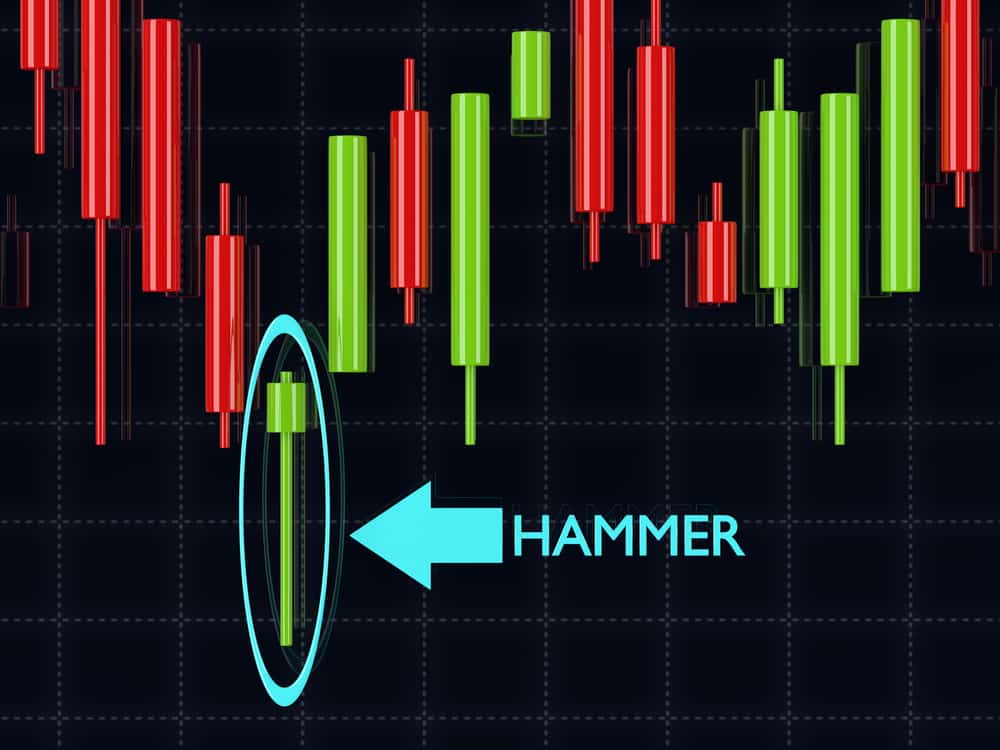
The hammer candlestick is a bullish reversal pattern that appears at a downtrend’s lower end. It indicates that sellers in the market had gotten in at the opening price, but the buyers were able to restore the prices near/above the open. The candlestick’s body shows the difference between the asset’s opening and closing prices. Besides, the shadow represents the highest and lowest prices within a period. The confirmation of the trend reversal to the upside occurs when the price starts to rise after the hammer candlestick.
How to recognize a hammer candlestick
As the name suggests, this candlestick pattern resembles a hammer. Its body is relatively small. The body is usually at the trading range’s upper end. Furthermore, the candlestick has a small or no upper shadow. In contrast, it has a long lower shadow that tends to be about double or triple the size of its body.
Notably, the body of the hammer candlestick pattern can be green or red. However, the color is not really important as both scenarios signify a bullish reversal. If the candlestick’s body is green, that’s a sign that the bullish reversal is stronger. In such a scenario, the bulls in the market are able to completely reject the bears’ lower prices. As a result, the prices surpass the opening price.
A red hammer candlestick is still a bullish pattern. It is an indication that while the bulls were able to reverse the downward trend, the prices did not get to the opening price.
Example of a hammer candlestick pattern in a chart

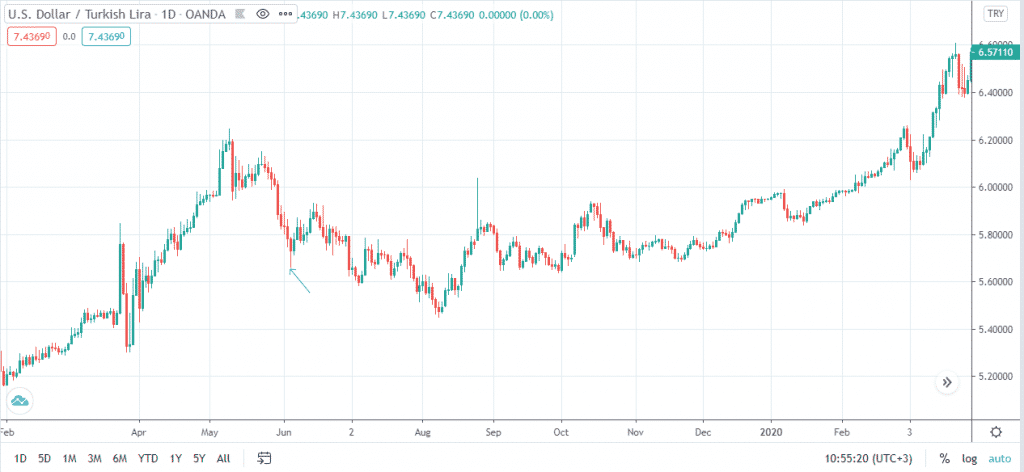
The image above is a USD/TRY daily chart, with the arrow pointing to a hammer candlestick. As aforementioned, the hammer is a bullish reversal pattern. As seen in the chart, the prices had been on a downward trend for several days. The formation of the hammer candlestick pattern is an indication that the bulls in the market were able to reject the lower prices. Subsequently, there was a trend reversal that pushed prices higher.
How to trade the hammer candlestick
One of the ways that a trader can use the hammer candlestick is to determine when and where to enter the market. In the example above, the prices were on a downtrend before reversing upwards. The area connecting the lows is referred to as the zone of support. As a trader, you can use this zone as confirmation of the reversal signal created by the hammer candlestick. When opening a buy position, you can place your stop loss below the zone of support. In such a scenario, the targets will be at the recent resistance levels. However, for this to work, it is crucial to maintain a positive risk-to-reward ratio.
While the candlestick is a useful tool in technical analysis, it is crucial to find supporting evidence before you decide to open a buy position. The appearance of a hammer candlestick does not necessarily mean that the prices will reverse upwards. As such, using several indicators will help you confirm the upward trend.


