- The Commodity Index is testing the long-term resistance.
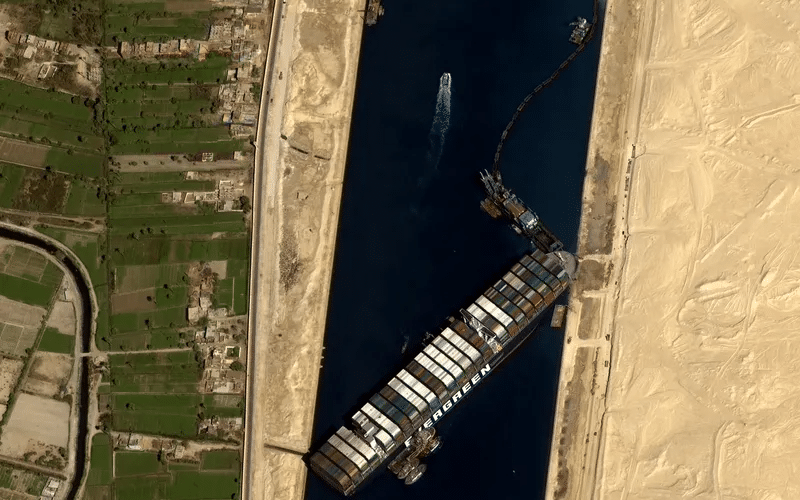
- The shipping jam in the Suez Canal may cause oil delivery delays.
- The technical picture of oil and natural gas offers trading opportunities.
Not so many people had talked much about commodities until COVID-19 struck the world and sent the markets in chaos in the first quarter of 2020. Since then, the world has witnessed wild rides in commodity prices. With oil going to zero and swiftly recovering to the pre-pandemic levels, the asset class got significantly more attention.
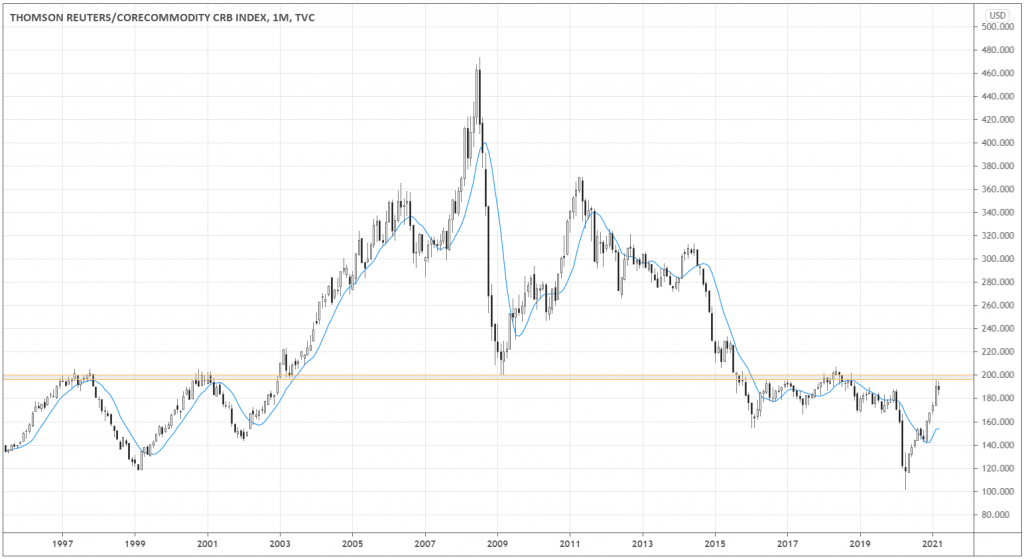
The monthly chart of the Commodity Research Bureau (CRB) Index below shows that the global commodity prices have approached the 200.0 long-term resistance level. Every time the index interacts with the level, we can expect global market changes and more trading opportunities.
The level has been tested numerous times from both sides since 1997 and is indicative of a global risk sentiment shift.
The index is also currently above the 200-day Moving Average, another evidence of an upcoming bullish trend in commodities.

Suppose the index manages to close above 200.0. In that case, we’d get a confirmation of the global breakout in commodity prices, especially if the monthly candle that breaks the level has a big white body. Another price action scenario is the consolidation for a few months above the level before the upward move continuation.
Alternatively, after such a powerful surge since May 2020, it’s normal to expect a correction. If April forms a black candle with the close below March’s low, the odds of a correction increase. It would be natural for the index to give up a half of its upward move, falling back to around 160.0, testing the Moving Average from above.
The fundamentals of the rising commodity prices
Below is the number of possible reasons for the bullish trend in commodities. We never know to what degree each factor impacts the market.
1. The US stimulus expectations
Addressing the COVID-19 pandemic, the Fed and other central banks injected a tremendous amount of money, devaluing fiat currencies, supporting commodities.
2. China drives the demand
China is one of the few countries that finished 2020, showing expansion in GDP. The country’s massive timely measures to contain the virus worked out well, activating industrial production and its demand for raw materials.
In January-February 2021, China’s industrial firms increased profits by 178.9% YoY to CNY 1.11 trillion, which is a strong signal of further demand for commodities from China.
3. Wrecked supply chains
The logistical challenges support demand in commodities as the supply chains cannot work at their full capacity due to lockdowns.
The possible catalyst of commodities breakout
Often extreme events stand as catalysts at the market’s turning points. The current shipping jam in Suez Canal may significantly impact the oil prices, as the stuck vessel also caused 16 oil tankers not to be able to sail through.
The total tonnage of crude and oil products amounts to 870,000 and 670,000 tonnes, respectively. Delays in oil deliveries due to waiting or rerouting may create a shortage in the market, pushing the oil prices higher.
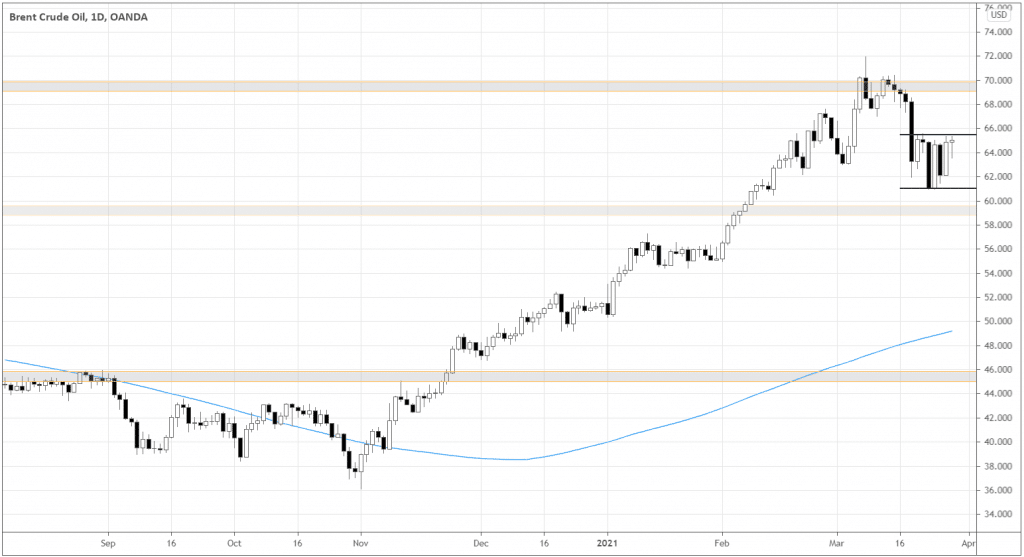
The Brent chart below gives us a perspective on planning potential trades in oil. We know that the market is susceptible to rapid changes in sentiment due to the shipping jam. Thus, we may expect momentum moves.

After the uptrend reached 70.0 resistance level, the market corrected and now formed a consolidation within clear boundaries – 61.0 and 65.5. The breakout in either direction may turn into reasonable moves.
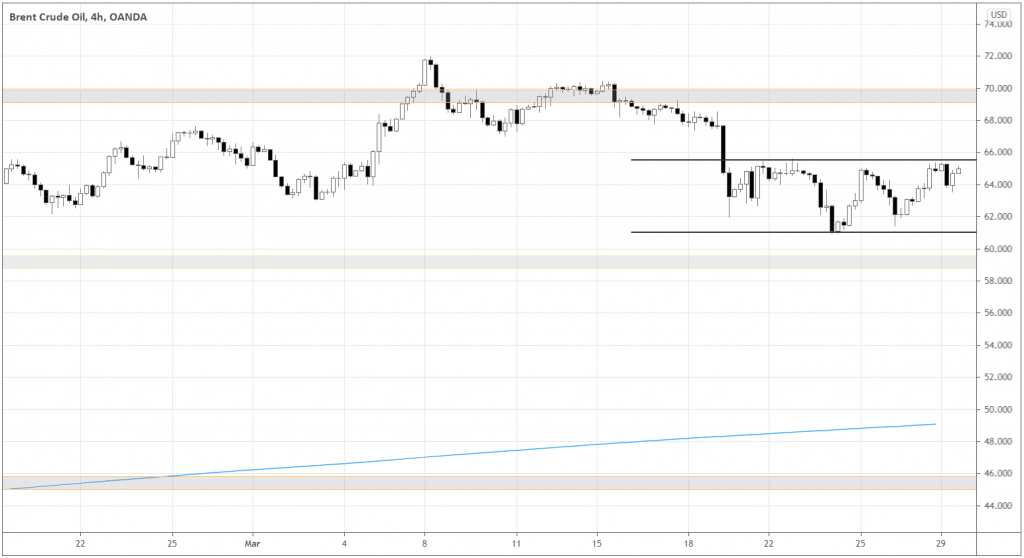
The 4-hour chart shows a detailed view of the market participants. Notice that the range’s upper boundary is tested more actively, and the lows are getting higher.

The recent price action and following the long-term uptrend’s direction give us more technical reasons to look into long trades.
Although the resistance 70.0 is close to the consolidation’s upper boundary, a potential breakout of 65.5 may be fueled enough by the Suez Canal situation’s sentiment to sustain the surge beyond the resistance.


