Good Morning, Good Evening!
A new year brings new candles, new opportunities and new challenges. I decided to write down my new thoughts and, where appropriate, reflect on my previous analyses.
Naturally, my primary focus is on the asset that leads the cryptocurrency market – Bitcoin.
I must mention that I am not someone with formal education in this field. I am self-taught, placing a strong emphasis on using Technical Analysis as the main component of my decision-making process. This stems from my belief that although the chart is difficult to read, it largely allows for the interpretation of the hidden intentions of “smart money.” I want to stress that the following words reflect only my personal point of view, which may not be correct, and that this publication is by no means investment or educational advice as understood by any law regulating such matters. I simply intend to ramble about topics I don’t fully understand.
Background
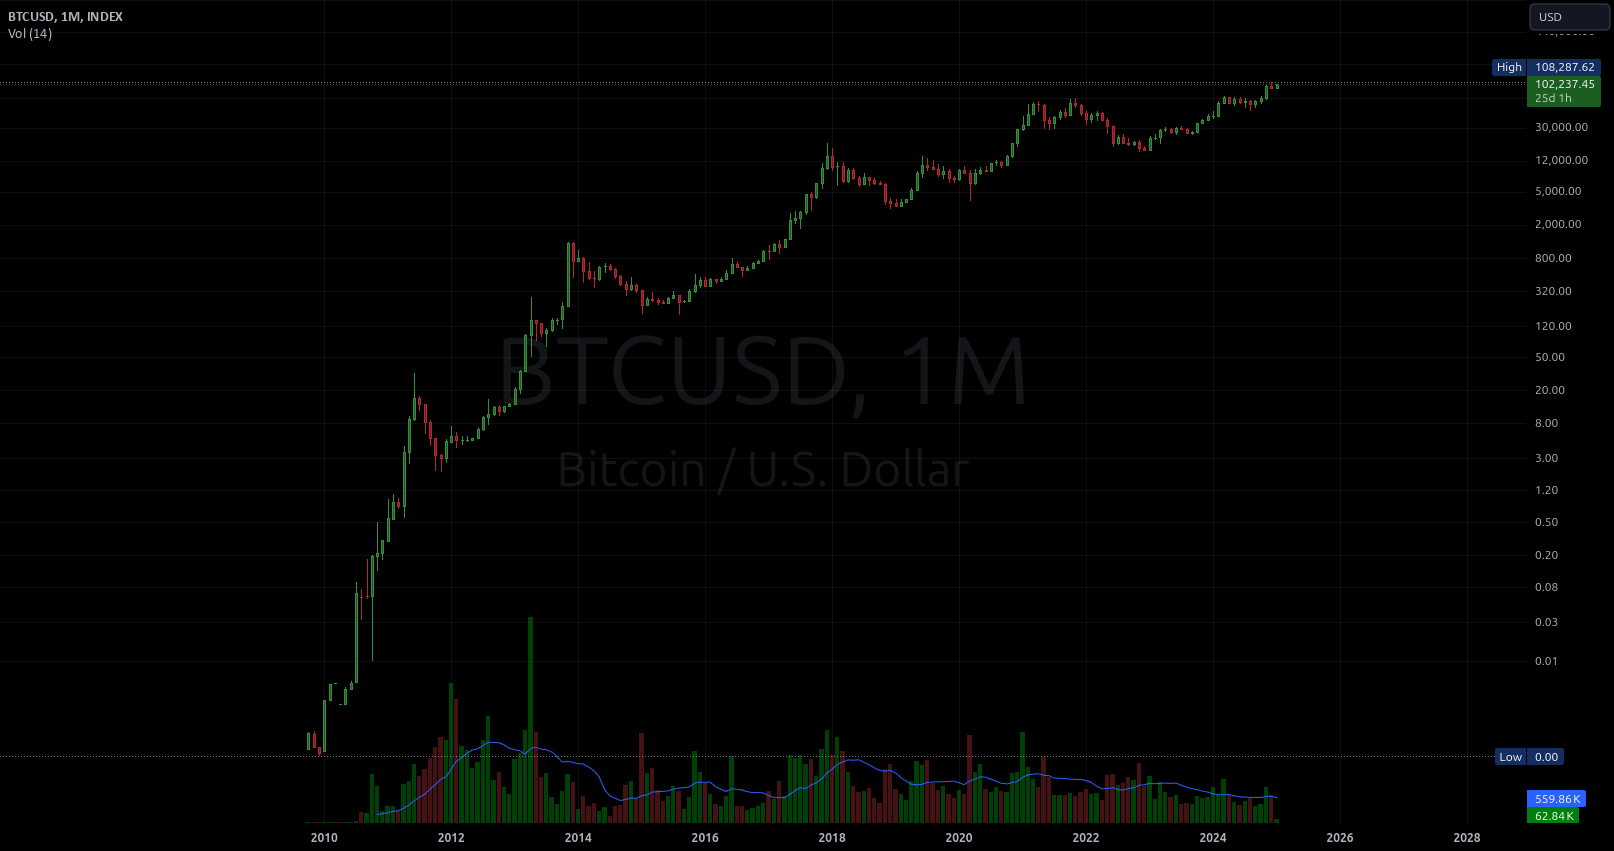
Since its inception, Bitcoin has been in a continuous long-term upward trend. Throughout this time, there have been four minor reaccumulation structures and four major ones, occurring chronologically. Each structure has taken progressively longer to form, and the upward trend has been gradually flattening over time.
Technical Analysis and Thoughts
In this analysis, I will apply tools from volume analysis, Wyckoff methodology, Volume Spread Analysis (VSA), and Elliott Wave Theory.
At the beginning, I will refer to an analysis I published about a year and a half ago on this platform: “Comparative Analysis of BTC,” 24.09.2023 (links attached).
Looking back at my previous analysis, I see that my reasoning and chosen tools were correct. As is often the case in attempts to master the market using Technical Analysis, the price action deviated from the expected scenario. However, the primary trend remained intact.
I missed certain key structures, such as the Spring, which I would interpret differently today. But I will get to that later.
The key resistance levels, derived from price structure and Fibonacci extensions, appear to have been recognized by the market. The price stalled just below the resistance level at 2.618, an extension based on the Spring-Buying Exhaustion range from 2015 and 2017/2018 reaccumulation phases.
Similarly, the external measurement of 1.618, calculated from the 2017/2018 Spring to the 2021 Upthrust, was respected by market participants. Both levels align perfectly with significant price points.
I mentioned that today I would approach the topic differently. This is due to the revealed market structure (it’s always easier to analyze when you can see everything, right? 😉) as well as the experience I’ve gained by continuously expanding my analytical horizon.
Looking at the latest high-order reaccumulation structure (December 2021 – March 2024), I realize I made an error in my interpretation. The overall price action indicates a lack of supply around the 16K level.
Interestingly, BTC/USDT on Binance shows significant accumulation, which I deduce from Bag Holding candles.
The core point of my argument is that I have witnessed the formation of a large accumulation structure, whose elements align with the Wyckoff methodology. The market behaved as expected based on this interpretation.
One particularly important element is the Last Point of Supply (LPS), represented by the March 2024 – November 2024 reaccumulation phase. I discussed this process in detail in my September 6, 2024 publication titled “Bitcoin – Technical Analysis.”
The ~250-day trading range, during which the price was stuck, allowed Smart Money to accumulate assets from those willing to sell. Despite the temporary stagnation, which I currently observe, the upward trend will likely continue.
The strength of this trend is confirmed by the use of volume-weighted average price (VWAP) anchored to the Test of Phase C, according to Wyckoff’s methodology.
When analyzing the three most recent tests in the three highest-order reaccumulation structures, I observe that the price moves within a channel defined by the second and third standard deviations.
I think that the current sideways structure is a Back Up to the Creek from the latest high-order reaccumulation phase. Its characteristics resemble a reaccumulation phase.
At this stage, I am unsure whether this structure will directly lead to a breakout to significantly higher price levels, or whether it will result in an Upthrust of a higher-order structure, followed by another Spring.
The structure shows declining volume and several Bag Holding candles, marked with green arrows on my chart.
The Upthrust does not exhibit distribution characteristics but instead suggests a lack of demand.
The candle marked with a question mark is interesting due to its dual nature. However, upon closer examination of the 4-hour interval, it appears to be an Upthrust of a lower-tier structure, aimed at absorbing supply.
I want to highlight the relationship between the Test of Phase C and the structure forming along previous peaks.
Considering the two most recent reaccumulation phases, the situation is as follows:
I do not take into account overly optimistic price movements that exceed the 8.0 external retracement level, due to the flattening of the global trend over time.
Instead, I consider more realistic targets based on Fibonacci levels, such as 3.618 and 2.618 extensions, indicating a price range between 170K and 230K.
In my September 24, 2023 analysis, I mentioned 240K as a 3.618 external retracement level measured from March 2020 to October 2021.
Using 1:1 geometry, I estimate that the price could reach around 250K, which aligns with my other methods.
Conclusion of the Analysis
I have presented various methods to identify the direction and potential range of Bitcoin’s price movement.
Although it is difficult to pinpoint the exact peak of the trend, the analysis provides sufficient signals to expect supply levels within the indicated price ranges.
Confirmation of a trend reversal would require a high-order distribution structure visible on higher time frames.
Final Thoughts
I have intentionally referred to my previous analyses to maintain continuity and to highlight both successes and mistakes.
The purpose of this reflection is to improve my analytical process by identifying what I did well and where I need to focus more in future analyses.
I believe that Technical Analysis, practiced for over a century, holds a certain beauty and logic. The process of applying it, and reaping its rewards, is an intellectual delight.
Ultimately, the weakest link is not the tool, but the person using it. Therefore, continuous improvement and patience are essential. The chart is the only reliable source that reveals the intentions of Smart Money or Composite Man, depending on the interpretation of market personality.
Thank you to everyone who has taken the time to read my thoughts. I hope you found them insightful, and that your time was well spent.
Wishing you health, perseverance, and successful trades.
May you master the art of recognizing well-formed market structures.
CatTheTrader


