Penny crypto is a colloquial term used to describe tokens with low market value, typically below $5. These tokens are preferred by investors because of their high growth potential, which could multiply one’s investment manyfold. However, due to their small market cap, they are prone to pump and dump schemes and other price manipulation tactics, which makes them a risky investment.
However, through extensive research, one can identify projects with significant profit potential. This may involve finding out the intrinsic value of the project and its technology, the prowess of the team behind it, or the publicity the coin manages to gather. All these could be driving forces behind its value increment. In this article, we shall focus on cryptos with market prices below 1 cent and how to trade them. But first, let’s look at the types of penny crypto in existence.
Types of penny crypto
These low-cap cryptocurrencies can be classified into four groups. The first is the newly minted coins, which oftentimes lack the publicity needed to pump up their demand and, consequently, their market value. A second type is the plentiful coins. These usually have a large supply, which, compared to their demand, contributes to their low market valuation.
Another penny crypto type is the fallen coins. These are coins that once had a significantly high valuation, but due to market shifts, their price plummeted to fractions of a dollar per piece. This could also apply to coins that were victims of pump and dump schemes or other malicious scams. The final classification of these coins is the stagnant cryptos. These are penny crypto that has existed in the market for a long time, yet they have never undergone any significant growth in value.
How to trade penny crypto
In the short term
Usually, penny crypto is characterized by high volatility, which makes them ideal candidates for short-term trades. For our intents and purposes, we shall be using the MACD indicator in conjunction with the 20-period Exponential Moving Average (EMA). The recommended timeframe for our chart is the 15-minute.
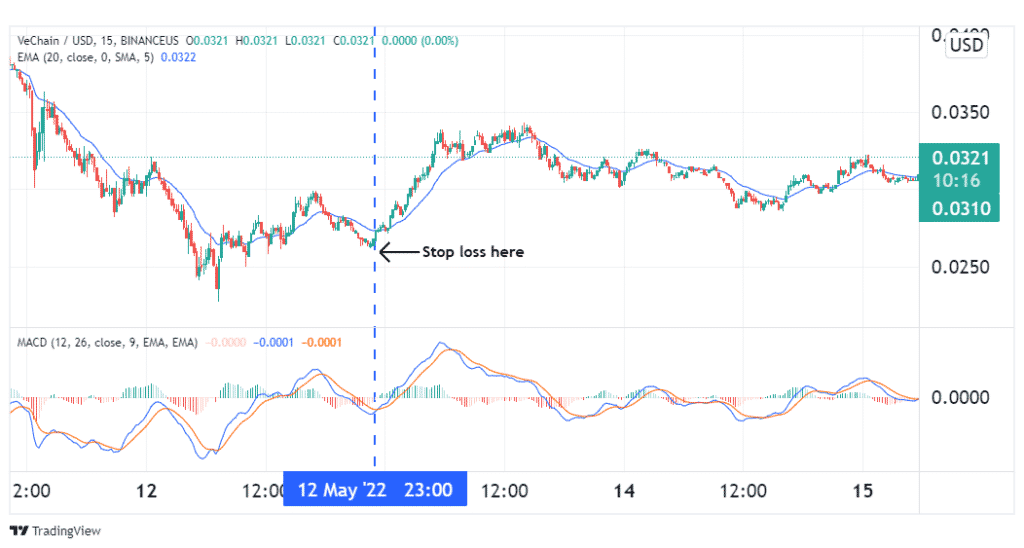
When trading a bullish setup, we expect the MACD to yield the first signal by manifesting a cross of the MACD line above the signal line. Moreover, the histogram will shift from negative to positive territory. Ideally, this signal should be confirmed by a price break above the 20-period EMA line.

The illustration above shows a VeChain 15-minute price chart. On 12th May, the blue MACD line crossed over the red signal line, yielding the first bullish flag. Shortly after, prices closed above the 20 EMA, confirming the bullish signal. This marked the entry of a long trade on the coin. A suitable stop-loss should be placed below the most recent swing low. The profit target, on the other hand, should be placed at a 1:3 risk to reward ratio or more. Alternatively, one could wait for prices to break below the EMA line, which they did on the 13th.
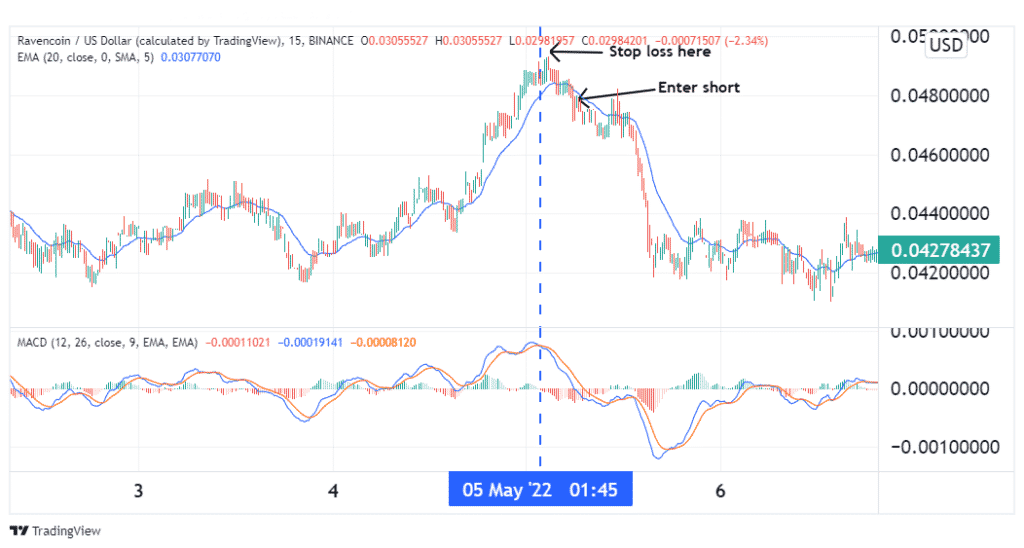
A bearish setup would manifest as the complete opposite – the MACD line would cross below its signal line. This would be confirmed by prices breaking below the EMA line turned support.

The illustration above shows a 15-minute Ravencoin price chart. On 5th May, the blue MACD line crossed below its red signal line, indicating a bearish flag for the coin. This was confirmed when a few candlesticks later, the price broke below the 20 EMA. This marked the entry for a short trade. A suitable stop loss should be placed above the most recent swing high. The take profit should be placed following a 1:3 risk to reward ratio, or one could wait for prices to cross above the EMA turned resistance.
In the long term
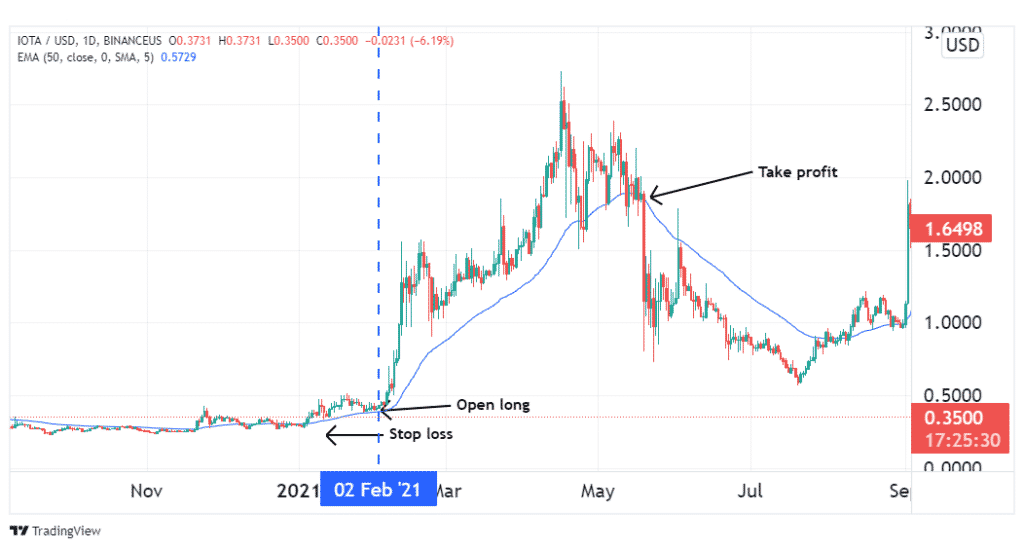
If you favor the HODL approach, you can identify penny crypto with substantial growth potential, then buy and hold for the long term. To help you better time your entry, you could use the 50 EMA on a daily price chart. A bullish setup will be marked by prices trending above this MA line. However, before placing your trade, wait from prices to retest this MA-turned support, and enter once prices bounce off of this level. This is illustrated below.

In the image above, IOTA was hovering above the 50 EMA since the beginning of 2021. In February, its price bounced off of this support line, which marked the entry of our long trade. A suitable stop loss should be placed below the prior swing low. The exit from this trade came in mid-May when prices crossed below the 50 EMA.
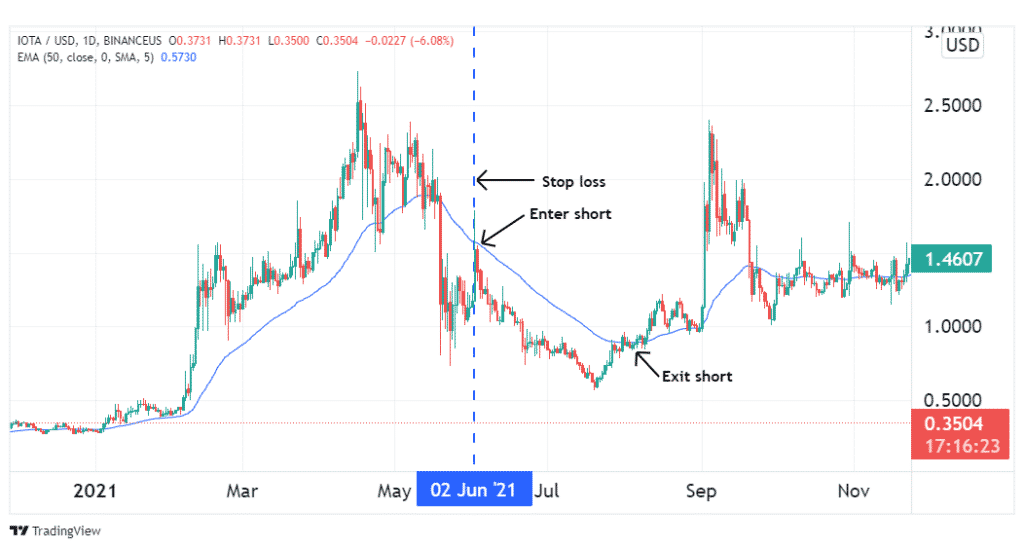
For a short trade, you would have to identify a coin in a downtrend, marked by prices trending below the 50 EMA. Next, wait for a retest of this resistance line, and when prices bounce off of it, enter your short. This is illustrated below.

Following our prior bullish example, IOTA’s price broke below the 50 EMA in May. On 2nd June, a retracement retested this line and bounced back, which marked the entry for our short trade. A suitable SL would have been placed at the prior swing high. The exit came in August when prices finally broke above the MA line.
Conclusion
Penny crypto is token with low market valuations. To that end, they are classified into plentiful coins, fallen projects, newly minted coins, and stagnant projects. Due to their low market cap, they are prone to price manipulation scams, which makes them a risky asset class. However, their volatility coupled with their growth potential makes them favorites among risk-tolerant investors, regardless of whether they are short-term traders or HODLers. If you want to invest in these tokens, you have to perform extensive research on the utility of the project, the team behind the project, and even the hype associated with it.


