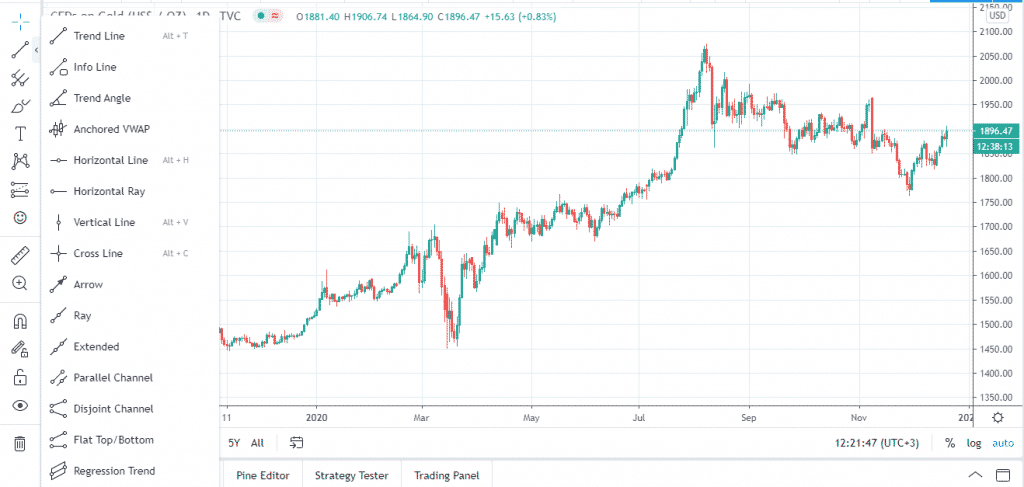
A trend line is a straight sloping line, connecting at least two price points. As a part of the technical analysis, trend lines are helpful in identifying and confirming a trend in an asset’s prices. By extending it past the current price level, a trader is able to determine the direction that a security is likely to take. You can draw a trend line on a candlestick, hollow candle, or Heikin Ashi chart. Drawing the technical analysis tool on a line is not advisable as it tends to show the price trend rather than the exact movements.

The two basic types of trend line are:
- Uptrend/ascending trend line.
It is a bullish sign that denotes the buying pressure in the market. If the prices move below the uptrend line, it may be a sign that the asset’s demand is reducing. Subsequently, the trend may be subject to change. When drawing it, you will need to connect the bottoms of several support areas.
- Downtrend/descending trend line.
It is a bearish sign, which highlights the selling pressure. To draw it, connect the peaks of notable resistance areas. In a scenario where the price moves above the descending trend line, there may be a possible change in trend as the asset’s supply lessens.
How to use a trend line
One of the main ways to use a trend line is to validate the identified support or resistance levels. The trend line will give you a clearer and bigger picture of the price action, which the horizontal support and resistance lines may not accord.
Besides, this technical analysis tool will help you identify the apt entry and exit points. Notably, buying closest to the trend line has a better risk-reward ratio.
How to draw a trend line
You need two price points to draw a trend line. However, you have to connect at least three points for the trend line to be solid. The more points you connect, the higher the validity of the identified support or resistance.
Another point that you should note when drawing a trend line is that the tool is not applicable in every chart. There are instances where you can’t find three or more price points needed to draw a solid trend line. In such a case, do not force it. Use other technical analysis tools to determine the direction of the security’s price movement.
The space between the price points on a trend line is another crucial consideration. The connected highs or lows should be evenly spaced. If the linked points are too close to each other, the resultant trend line may be invalid. Similarly, highs/lows that are too far apart may not have a viable relationship. The apt space between the points will depend on the intensity of price movements, timeframe, and your perception of the chart as a trader.
The angle of a trend line also matters. A very steep line will lower the validity of the identified support/resistance levels and has a higher chance of breaking.
Once you have made all the aforementioned considerations, it is now time to draw a trend line. Start by identifying the timeframe that suits your trading needs. For instance, if you are a day trader, you may want to draw your trend line on a daily chart.
Secondly, zoom out the chart. This will help you view the bigger picture as opposed to focusing on the most recent price action. Subsequently, draw the trend line by connecting at least two key swing points. Ensure that you get several touches. For example, if you are using a candlestick pattern chart, the line should touch the wick or body of several candlesticks.


