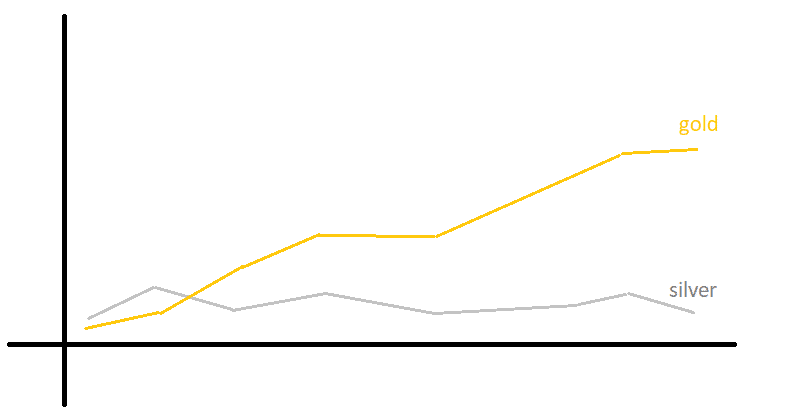
If you see gold closing in green for three weeks straight and silver staying idle, what does it mean to you? The only coherent answer should be “gold is growing, and silver doesn’t,” or “gold is stronger than silver.”
More importantly, what will you do about it if you were to make a trading decision? Does it matter if you look at gold and silver, forex pairs, or stocks? Let’s talk about relative strength.
What is relative strength?
Suppose we compare a financial instrument’s price with the price of another one or with any figure representing a market’s segment. By dividing one asset by another, we’ll get a number that shows the relative strength at a specific time.
Let’s get back to gold and silver. If one ounce of gold costs $1800, and the same weight of silver is priced at $27, the relative strength of gold to silver is 66.6 ($1800/27). In other words, we can get 66.6 ounces of silver for one ounce of gold.
The number carries any meaning when we compare the dynamics of the readings over time. For instance, if after the first week the relative strength was 65.5 and 66.00 after the second one, the conclusion is gold is getting relatively stronger against silver.
Read the chart
Imagine you want to buy precious metal, but you’re not sure which one will likely grow more in terms of percentage. In our example, just type XAU/XAG, and the platform should show you a chart of the relative strength of the two assets.
Serious charting software like TradingView or Thinkorswim allows custom charts based on your formula.
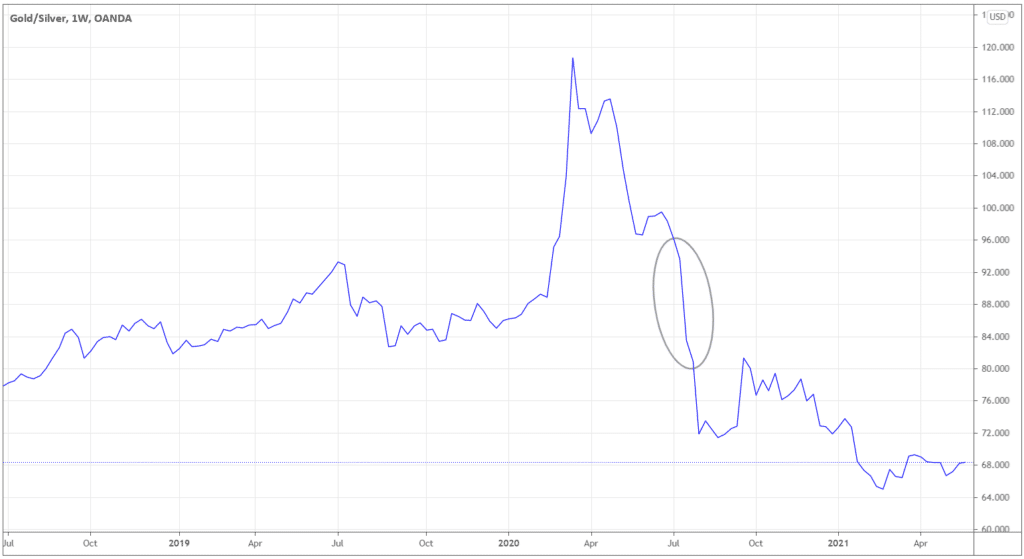
When you look at the relative strength chart, the direction will help you to see which asset is stronger on a relative basis.
In the example above, you wouldn’t want to buy gold in July 2020, as the yellow metal was getting relatively weaker against silver. Although, throughout 2019, it wouldn’t matter much if you bought either metal for dollars, as gold and silver were ranging against each other on a relative basis.
Technical analysis works here too!
Relative strength charts behave similarly to standard charts in a way that we can apply technical analysis principles there too.
In our XAU/XAG example, you can find familiar supports and resistances.
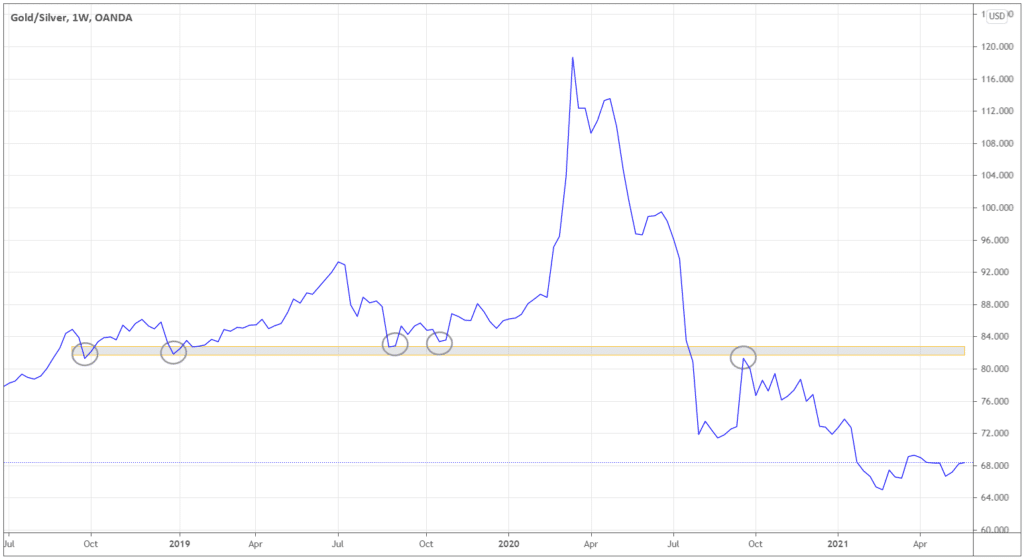
Let’s look at the chart above. When the ratio approaches a critical level, like the one at 82.5, expect some change in the pace of growth (or decline) of one asset against another.
Look at the last rebound from the 82.5 support area at the beginning of October 2019. You could base your trade on this setup and buy gold instead of silver against the US dollar.
The chart below shows the percent change of two precious metals against the US dollar for the next several months.
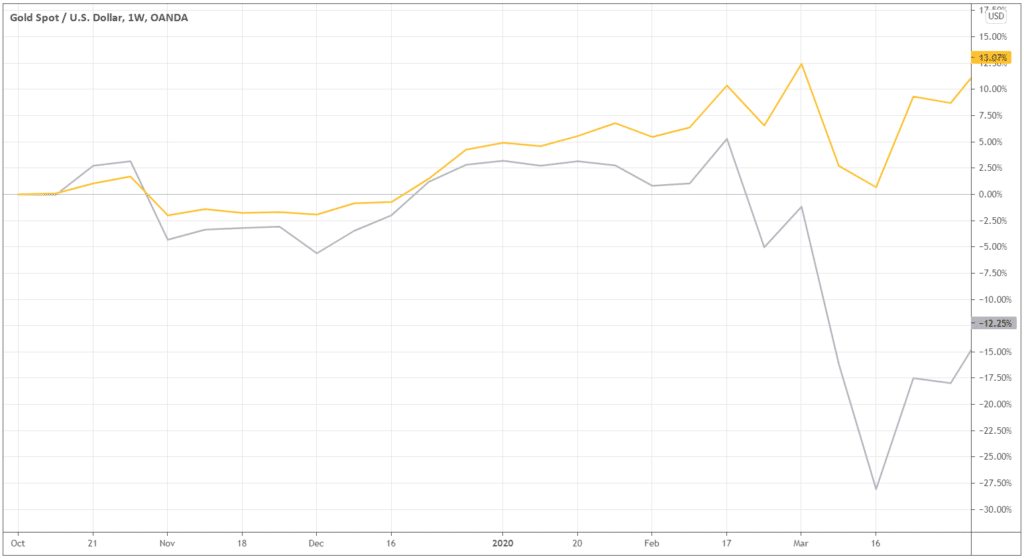
If you bought gold (see the yellow line) at the beginning of October 2019 and exited in March 2020, you’d make a profit, while you’d surely be in red if you bought silver (the grey line).
How does it work in forex vs. other markets?
Forex offers more flexibility in employing the relative strength principles. Say you see a potential long setup in AUDUSD and USDJPY.
Instead of going long on both pairs or choosing only one and risking losing an opportunity in the other one, you can buy a cross pair AUDJPY. In this way, you’re buying the strongest and selling the weakest among the three. In addition, you’re avoiding direct exposure to USD, thus limiting risk.
Let’s take a similar example in stocks. What if you see some strength in the shares of Apple and the weakness in Facebook stock? If you aim to take only one position, you won’t be able to do it as we cannot exchange stocks for stocks. The transaction must involve a currency. To exploit the outlooks for both stocks, you’ll have to buy shares of Apple and short-sell shares of Facebook.
Some stocks are extremely hard, if not impossible, to borrow, so you won’t be able to short-sell them.
The same issue is with other assets – you cannot directly exchange futures contracts, ETFs, or bonds without involving a currency in which they are quoted.
Relative strength trading techniques in forex
Let’s look at different ways of using relative strength in trading forex. Some of the techniques below traders can easily replicate in other markets.
1. Who’s first?
Below are two pairs that are forming a similar setup at the same time. The idea is to buy once the market breaks out from the consolidation (a blue arrow), following the uptrend. We want to buy above the grey line. For GBPUSD, the key level is 1.41, and 1.2630 is the resistance of GBPCHF.
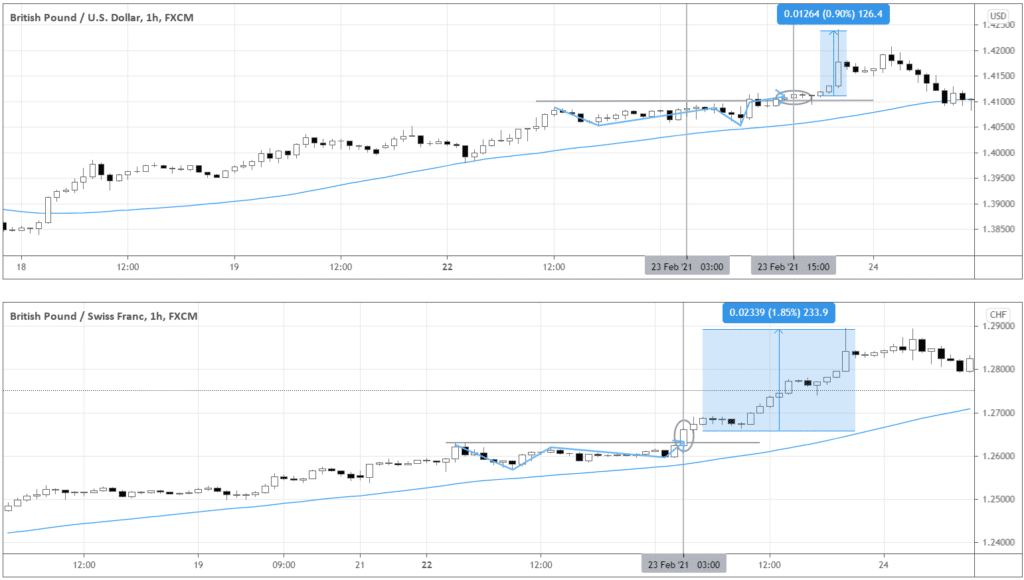
Which pair should you choose? Usually, the instrument that triggers an entry first is the one. In the example above, GBPCHF broke out first at 3:00, while GBPUSD provided an entry only at 15:00. Eventually, if you held GBPCHF, you could ride a 1.85% move instead of 0.90% in the case of GBPUSD.
It’s safe to choose a pair that outstrips the opponent. As you hold a position in the relatively stronger instrument, the ride is likely to be smoother – there shouldn’t be too deep pullbacks against your position.
2. Look under the hood
We can get another signal of which pair to choose by comparing currencies we want to trade against. Let’s get back to our example with GBPUSD and GBPCHF.
To find the weakest link to buy GBP against, check the USDCHF.
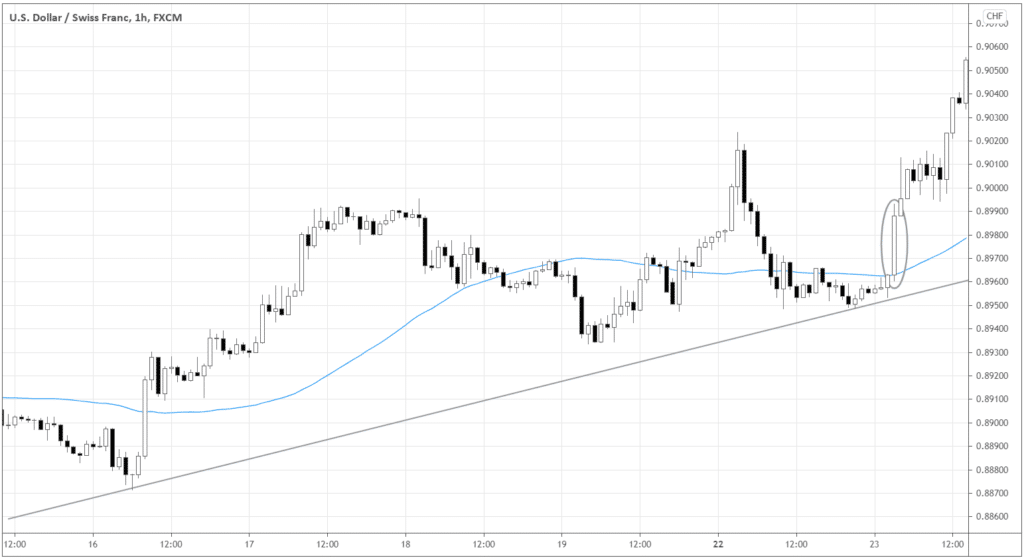
For the last week, USDCHF is trending up overall, as we see higher lows and higher highs. When GBPCHF offered an entry trigger, USDCHF formed a big white candle, apparently trying to continue the uptrend. If the USD grew against the CHF, the weakest link is CHF, so we want to buy GBPCHF.
3. Big picture – currency index
Finally, we can foresee the strongest and weakest currencies by looking at the currency index. You can find one of the best versions of the index at mataf.net. The index shows the change in one instrument against all other ones.
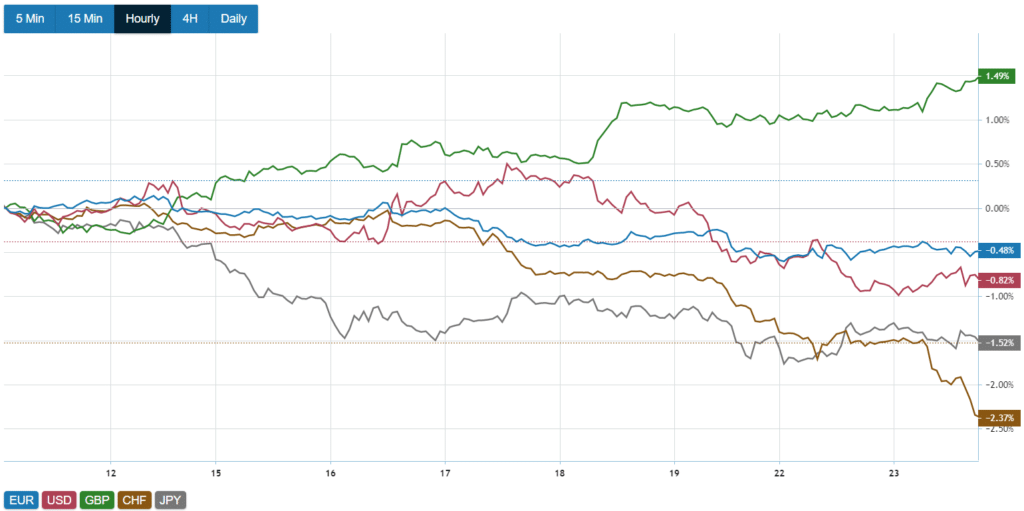
Before our entry on February 23rd, GBP undoubtedly stood out as the strongest currency. USD started to consistently outperform CHF from February 16th, and we could see in advance the relative weakness of CHF.


