The Triple Exponential Average (TRIX) is a technical oscillator used to determine the momentum of an asset’s price. Like other oscillators, it oscillates above or below zero. It represents the change rate of a triple exponentially smoothed MA (moving average). In simple terms, it is the EMA (exponential moving average) of an EMA. The triple smoothing enables the filtering out of erratic price movements. The indicator is also useful in identifying bearish or bullish divergences.
How to calculate TRIX
To obtain the triple exponential average, you will need to use the EMA. Since the oscillator is triple smoothed, it means that its calculation involves computing the EMA of an EMA’s EMA.
Let’s use 20 days as an example in the calculation of TRIX.
The first step is to use the closing prices of the 20 days to calculate the EMA.
The EMA formula is:

where:
t=today
y=yesterday
k=multiplier. To get the multiplier, compute 2/(time period + 1).
In the 1st step, EMA (y) will be the simple moving average (SMA). It is obtained by summing up the closing prices and dividing the total by the period.
As for the 2nd step, compute the EMA of the 20-day period using the EMA from the 1st step. Subsequently, use the EMA obtained from the 2nd step to calculate the EMA of the 20-day period. As the final step, use the figure obtained from the 3rd step to get the % change of 1 period.
How to use TRIX in trading
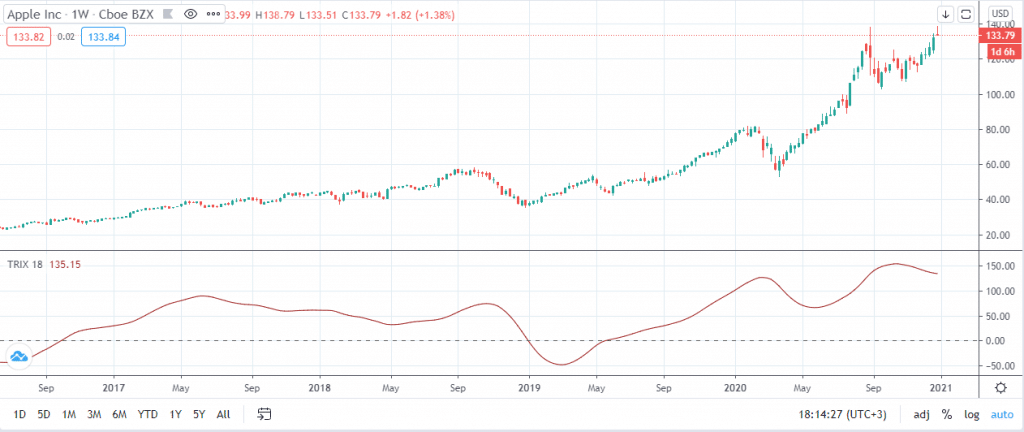
Just like the other indicators, TRIX is not applicable in all trading scenarios. However, TRIX is useful to traders in various ways. To begin with, one can use it to identify the direction of an asset price. It is important to note that the indicator defines the existing momentum but does not predict price action. A TRIX that is below zero is a sign that the price momentum is bearish. Similarly, if the TRIX is above zero, that is an indication of bullish momentum.
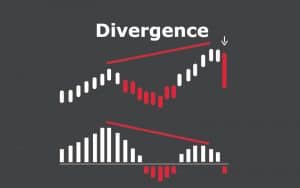
TRIX is also helpful in identifying a divergence between the direction of the candlesticks and that of the TRIX line. With the candlestick and TRIX line headed in different directions, the latter entity will help you identify the actual trend of the security’s price.
For a bullish divergence, the candlestick will indicate that the price is on a downtrend while the TRIX line is still headed on a downward momentum. Conversely, a bearish divergence occurs when the candlesticks reveal the upward momentum of the price while the TRIX line is on a downtrend.
Example of TRIX

The image above is the daily chart of Apple stock. The red line below the candlestick pattern is the TRIX line. In this case, it represents 18 days, as indicated above the line. As aforementioned, if the TRIX line remains above zero, that is a bullish sign. In the chart above, the line is currently at around $134. As such, the indicator shows that the asset prices are on an upward momentum.


