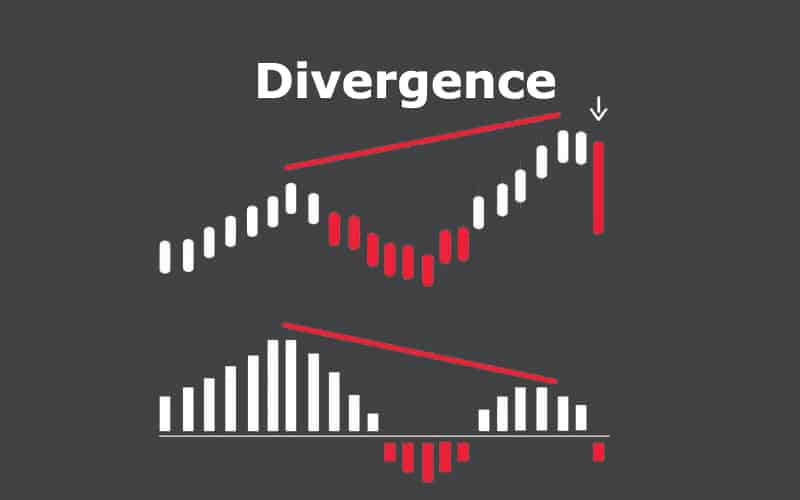
In forex, divergence appears when a security’s price moves in a different direction from an oscillator or other technical indicator. It may also be that the price movement is contrary to the released data. A divergence can either be bullish or bearish. It signals a trend continuation or reversal.
Types of divergence
Regular divergence
A divergence can either be a regular or hidden one. In both cases, it appears as being bullish or bearish. A regular divergence usually signals a trend reversal. Notably, oscillators are crucial in spotting a divergence. It signals the trader that though the prices are moving higher or lower, the trend is unsustainable and that the momentum is about to shift.
A regular bullish divergence is observable at the lower part of a downtrend. As a distinguishing feature, you will realize that the security’s price is resulting in lower lows while the oscillator is forming higher lows. After the second bottom, the oscillator may not form a new low. In such a situation, the price is likely to take an upward momentum.
Conversely, a regular bearish divergence occurs when an asset’s price is on an uptrend. To identify it, you will notice that the price is forming a higher high while the oscillator is at a lower high. After the formation of the price’s second high, the oscillator may show a lower high. If that happens, there is a likelihood of the trend reversing downwards.
Hidden divergence
The other broad type of divergence is the hidden one. Don’t be confused by the term. It is not necessarily that a hidden divergence is harder to spot than a regular one, but that it ‘hides’ in the price trend. As aforementioned, a regular divergence is a sign of a probable trend reversal. On the other hand, hidden divergence is an indication that the current trend is likely to continue.
A hidden bullish divergence occurs while an asset’s prices are on an uptrend. While the price forms a higher low, the oscillator signals a lower low. In comparison, a hidden bearish divergence appears when the security’s prices are on a downtrend. As the price forms a lower high, the oscillator shows a higher high. The setup is an indication that the prices are likely to continue with the downtrend.
Interpretation of divergence
A trader can use divergence to determine if the trend of an asset’s price will continue or reverse. This is made possible through the assessment of the momentum. To do so, one can plot the relative strength index (RSI) or other relevant oscillators on the security price chart. In an ideal situation, the RSI will form higher highs as the price does the same.
However, you may realize that the RSI is hitting a lower high when the asset price is at a higher high. This may be a signal of a weakening uptrend. At this point, you may choose to place your stop loss at an appropriate position or exit the trade to protect yourself from the probable decline in price.
Limitations of divergence
As a trader, you should not rely solely on divergences in your technical analysis. To start with, the appearance of divergence does not necessarily mean that a reversal of the price trend will occur. Even if it does, it may not do so immediately. As such, it is crucial to incorporate other technical analysis tools to avoid hefty losses.
Furthermore, it is important to use other indicators to confirm your interpretation of the divergence. This is because the setup is not observable in all trend reversals. As such, including other tools will help you conduct a comprehensive analysis.


