Death cross definition
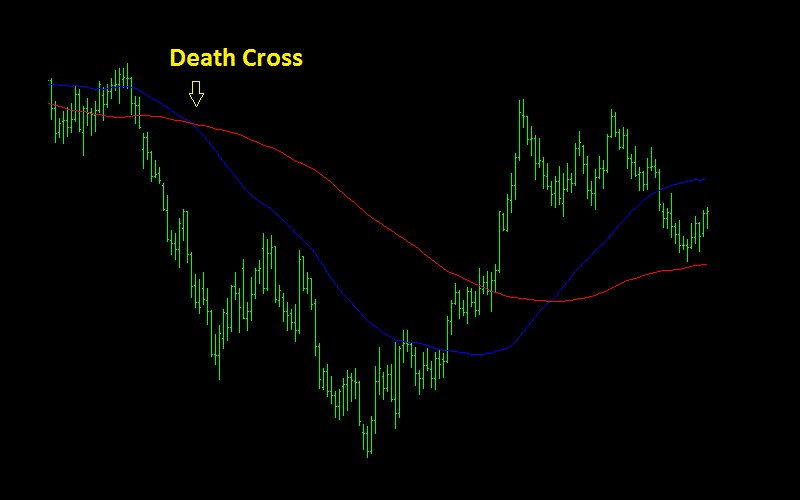
The death cross is a technical indicator that appears when a short-term moving average crosses the long-term one to the downside. It is usually a signal that the existing uptrend has come to an end, and a prolonged bearish trend is now on.
The timeframes of the moving averages largely depend on the trader’s strategy and preferences. One of the popular pairs is the 50 and 200-day moving averages. However, one can substitute the short-term moving average with durations like 15 or 20 days. On the other hand, a trader may choose to use 50 or 100 days as the span of the long-term moving average. It is also possible to identify and use the pattern on an hourly or four-hour chart.
Stages of the formation of a death cross
There are three distinct phases that are observable during the formation of a death cross. Firstly, the existing uptrend appears to be at its peak. This is usually an indication that the buying momentum is slowing down. Subsequently, the asset’s price starts to decline as the bears gain control of the market.
In the second phase, the asset’s prices continue to fall till the crossover occurs. Once the short-term moving average crosses over the long-term one to the downside, that is a signal of the onset of a bear market.
In the final stage of the death cross, the downward momentum continues. The downtrend needs to continue for a considerable time frame as confirmation of the new bearish market. If the new trend is short-lived and the prices head back up, the death cross is perceived to be a false indicator.
Limitations of the death cross
Most traders and analysts understand that one cannot rely solely on the death cross for an accurate prediction of the price movement. This is largely because of the indicator’s lagging nature. In some cases, the crossover may occur way into the new bearish trend. In such a scenario, the trader is likely to incur hefty losses as the asset’s price will probably have fallen significantly prior to the crossover.
As a solution to the indicator’s lagging nature, some traders and analysts interpret the death cross in a different way. This involves defining the death cross as when the price drops past the long-term moving average. That point usually emerges before the ordinary crossover.
Such a scenario is observable in the S&P 500 index chart below. You will notice that the crossover, which is indicated by the arrow, occurs when the bearish trend has already occurred. However, if a trader used the variation where the death cross occurs when the asset’s price crosses the long-term moving average, the incurred losses would be capped.

Besides, it is advisable to use other technical indicators to confirm the new bearish signal. One of the applicable tools is the trading volume. The death cross is viewed as a reliable signal when it emerges alongside large trading volumes. The rise in trading volumes is an indication that investors are getting onto the new wave, and the selling pressure is on.
Another viable confirmation tool is momentum indicators. The applicability of these indicators is founded on the fact that the momentum of the existing trend tends to slow down in the event of a looming reversal.


