What is a shooting star candlestick?
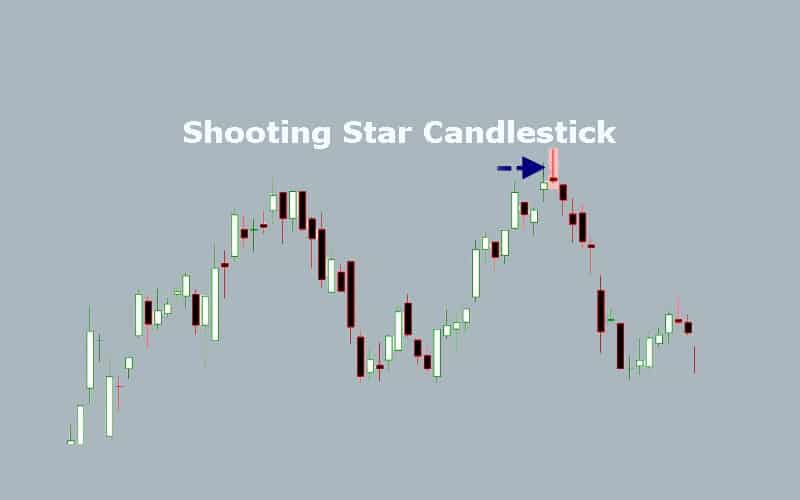
A shooting star candlestick is a bearish reversal pattern that forms when an asset’s price is on an upward trend. It occurs when the bulls in the market take on the market but later face a build-up of the selling pressure. Subsequently, the financial instrument closes near the day’s opening price. The candlestick acts as a signal that the trend is about to shift downwards.
Defining features of a shooting star candlestick
To identify a shooting star candlestick in a chart, it is important to look for certain defining characteristics. To begin with, the length of the candle’s upper shadow exceeds that of the body by about 2-3 times. The body is usually quite small. This is an indication that while the asset’s opening price was higher, the sellers successfully rejected the rise. The bears took control of the market, causing buyers to exit the trade and pushing the prices lower.
On the other hand, the candle’s lower shadow is small or non-existent. From this description, a shooting star candlestick is somewhat of an inverted T. Whether it is green or red, it is still a valid bearish reversal pattern. However, a red shooting star is slightly more bearish.
Interpretation of the shooting star candlestick
This candlestick pattern usually forms when the asset’s price is on an uptrend. Its reliability as a trading signal is high when it appears after at least three bullish candlesticks with higher highs. It can also be observed when the prices are generally rising, but there are a few bearish candles.
As the shooting star starts to form, the asset’s price will continue to rally. However, the bears erase the daily gains by heightening the selling pressure, pushing the prices close to the open. It is an indication that the bulls are losing control of the market.
Like many other candlestick patterns, the candle that follows the shooting star offers the needed confirmation. Its high should be lower than the shooting star’s high. Similarly, its closing price should be below that of the shooting star. This will confirm that the prices are likely to continue with the downtrend.
In the event that the candlestick after the shooting star symbolizes a rise in price, a trader may still use the shooting star as a resistance level. For instance, one may look to see if the prices will consolidate around that price level.
Example of a shooting star pattern in a chart

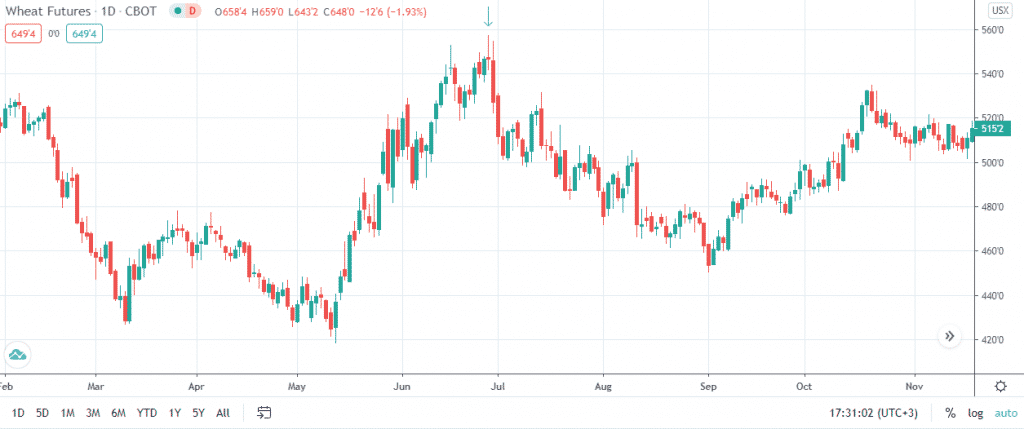
The chart above is a daily chart of wheat futures. The arrow is pointing to the shooting star candlestick. While there are a few bearish candles prior to the shooting star, the prices are generally rising. As confirmation, the high of the succeeding candlestick is lower than that of the shooting star. Furthermore, its closing price is lower than that of the shooting star. As a bearish reversal pattern, the trend shifts, and the prices take a downward trend.
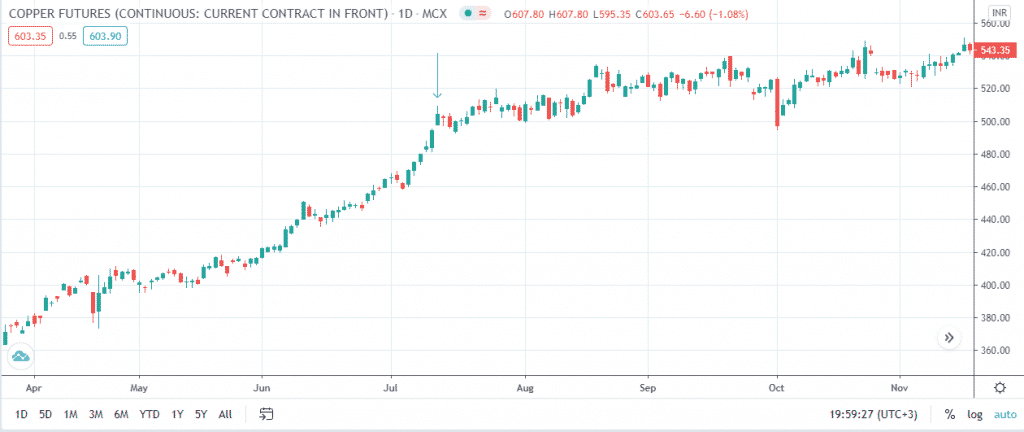
As aforementioned, a shooting star pattern may form a resistance level rather than a downward reversal. Such a scenario is evident in the daily copper futures chart below. As expected, the shooting star forms while the prices are on an upward trend. However, there is no trend reversal. Instead, the prices find resistance along the level of the shooting star.


