The broadening bottom is a divergent chart pattern indicating an upward breakout. The trend of the security’s price before the formation of the design is downward/bearish. The pattern widens or diverges over time, indicating a short-term bullish reversal. In contrast, the broadening top appearance begins with an uptrend of prices as the pattern displays its existence. A typical example of the broadening bottom is the 5-point reversal pattern.
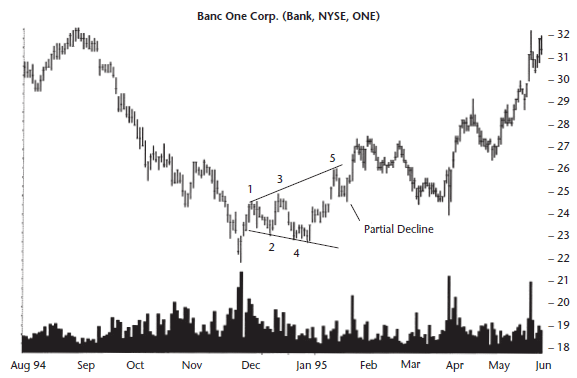
Figure 1: Broadening bottom example with 5-point reversal sections
In this reversal pattern, point 1 shows the stock’s first rise after reversing its downward price movement. Point 2 shows a positive decline before rising to point 3. Points 4 and 5 complete the W-shape of the bottom pattern before it completes the bullish pattern. The two minor points (2 and 4) are the lower sections, while the three minor highs (1,3 and 5) indicate the reversal’s strength.
Identification
It is vital to differentiate the broadening bottom in appearance from the dead-cat bounce. The latter is a short-term reversal that describes a temporary rise in stock price, followed by the continued downtrend. The broadening bottom forms after it announces the beginning of the recovery process. The main features of this pattern are shown below:
- Declining prices in a bullish market mark the beginning of the broadening bottom.
- The five-point pattern that marks the broadening bottom has three higher points (1,3 and 5) and lower lows (i.e., 2 and 4).
- There are two divergent/widening trendlines. The top line moves up while the lower trend line goes down, forming opposite slopes.
- The pattern has an upward volume indicating low volatility of the stock price.
- The breakout is not limited to any time frame, and it may either move downward or upward before the definite pattern is formed. The breakout occurs when the stock’s price rises above the broadening bottom’s highest high.
For example, in figure 1, the breakout is seen after point 5. The stock rises above $26. The breakout price is thus $26.
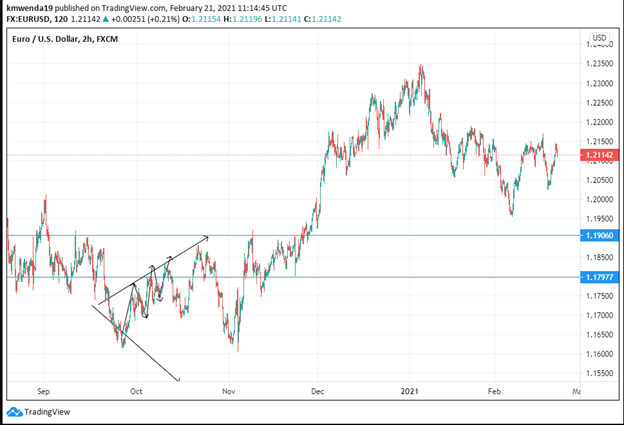
Figure 2: EUR/USD broadening bottom pattern
The broadening bottom in the 2-hour chart begins on September 17, 2020. The pattern forms a 5-point reversal trend shape. Point 1 – starts at 1.17844, point 2 at 1.16894, point 3 at 1.18210, point four at 1.17444, and 5 at 1.18477. This trendline has created three psychological support sections. The breakout occurs after point 5, with the reading slightly above 1.18577 and at 1.19060.
Price determination
The 5-point reversal pattern is a rare formation that depicts a partial decline and an uptrend in prices. To explain figure 2, here is a graphical representation of the broadening pattern.
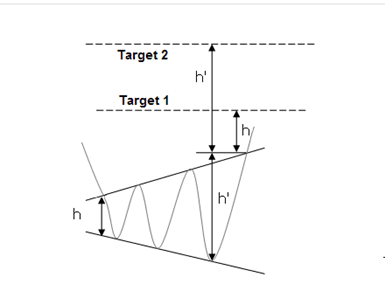
Figure 3: Determining the price objective and support
As noted earlier, a bearish movement precedes the formation of the broadening bottom pattern. In our case of the EUR/USD trading pair, the broadening bottom was caused by cheap purchases making the currencies hit the highest point. Investors are, however, filled with indecision, and the pressure to sell the currency remains robust.
We determine or project the price by locating the breakout point and plotting the triangle’s top end (see figure 3). The trader can also plot the breakout point’s maximum height to understand price movement. In figure 2, we noted that the price could move as high as 1.19060, although the breakout was seen at the 1.18500 points. The maximum height will help you determine the currency pair’s bearish or bullish price trend during analysis.
A bullish exit of the pattern forms in almost 58% of all broadening bottom analysis cases. In the case of a bearish market, the exit takes place when the price range is in the lower third of its annual range.
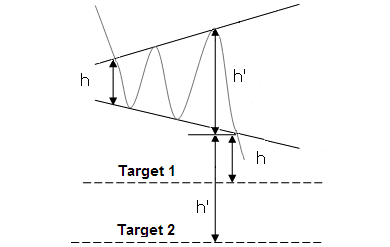
Figure 4: Bearish broadening bottom pattern
In a bearish pattern, the trader will determine the difference between the highest and lowest points of the formation before adding it to the minor low.
Trading style
- If you want to predict a bullish reversal using the broadening bottom, get the difference of the high and lowest points and add it to the breakout point to get new support.
- Buy the stock or the trading pair after you have identified the lowest trendline of the broadening bottom formation. In figure 2, you will buy the EUR/USD pair after placing point 1.17977 as the lowest/support trendline (you will go long at this point).
- To protect your trade from going below the trend reversal point (if you place a bullish bet), put a stop-loss order approximately 0.15 below the minor low point. For example, point 2 describes the little low end at 1.16894. In this case, the stop loss is placed at 1.01894.
- After the trading prices begin to head downwards after point 5 (the highest top in the patter) sell short.
- Lower or raise the stop-loss after prices make a recent high – partial rise (for long trades) or low-partial decline (for short sales).
- The decline or rise of the broadening bottom should determine whether the trader will short or go long in the trade.
Conclusion
A broadening bottom is a divergent (triangular) pattern formed after the trading pair or stock begins a bullish reversal from a downtrend in price. It differs from the broadening top in that the top design is developed when prices are in an uptrend before hitting a reversal pattern. It joins a five-point reversal formation, with the first point being the beginning high point then followed by the minor lows. There are two minor lows and three nominal highs in the broadening bottom.
The trader should measure or compute the difference between the highest and lowest points in the bottom and add or subtract to get the price objective. They should also use the highest point in the pattern to identify the breakout point. Correct application of this point helps to estimate the target price of the security. Use the stop-loss when you evaluate a partial or long decline in prices.


